Hello Friends,
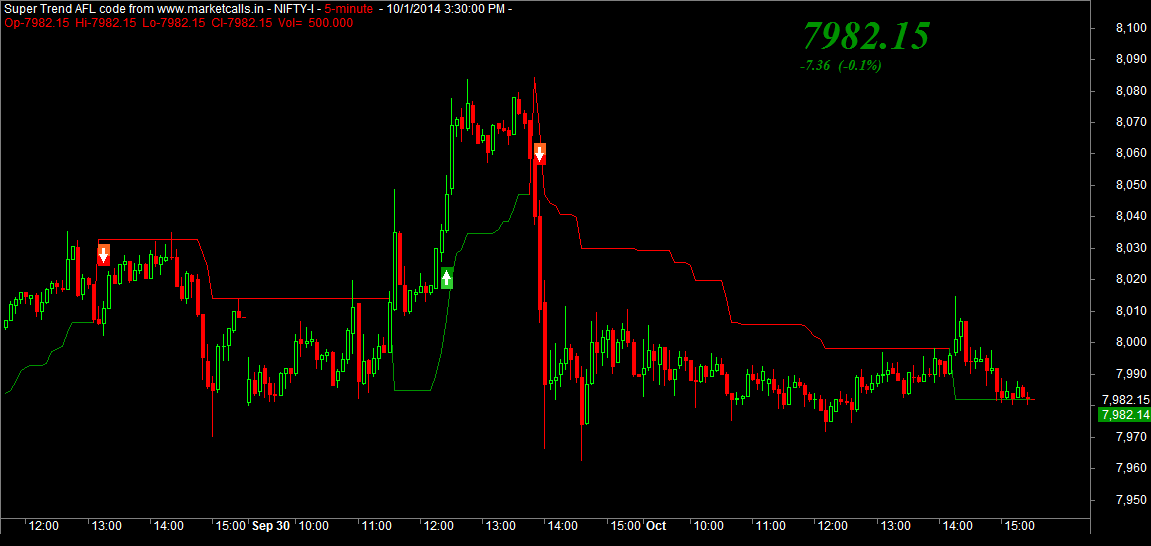
In below mention afl i required some help with buy and sell signal.
When i wanted to delay buy and sell signal to next candle.
If buy signal comes and next candle crossed the high of that buy candle then only Buy Signal should be considered and for sell vise varsa.
ALF cade is as below.
_SECTION_BEGIN("Price");
SetChartOptions(0,chartShowArrows|chartShowDates);
_N(Title = StrFormat("{{NAME}} - {{INTERVAL}} {{DATE}} Open %g, Hi %g, Lo %g, Close %g (%.1f%%) {{VALUES}}", O, H, L, C, SelectedValue( ROC( C, 1 ) ) ));
Plot( C, "Close", ParamColor("Color", colorBlack ), styleNoTitle | ParamStyle("Style") | GetPriceStyle() );
_SECTION_END();
// RSI Levels - appplied to Price Chart shows how far
// tomorrow's closing price has to move in order for
// the RSI to cross the 70, 50 & 30 levels.
pd = Param("Periods",200,5,200,1);
pds = 2*pd-1;// (Adjustment for Wilders MA)
aa = Close-Ref(Close,-1);
uu = EMA(Max(0,aa),pds);
dd= EMA((Max(0,0-aa)),pds);
rf = IIf(C>2,1000,10000);
c1 = Param("Upper Level",52,50,90,1);
qq1 =100/(100-c1)-1;
ff1 = qq1*dd-uu;
ff2 = ff1/qq1;
f1 = Max(ff1,ff2);
UL = Close + f1*(pds-1)/2;
UL = IIf(UL>C,floor(UL*rf),ceil(UL*rf))/rf;
c2 = Param("Equilibrium",50,50,50,0);
qq2 =100/(100-c2)-1;// [=1]
ff = dd-uu;
MM = Close + ff*(pds-1)/2;
MM = IIf(MM>C,floor(MM*rf),ceil(MM*rf))/rf;
c3 = Param("Lower Level",48,10,50,1);
qq3 =100/(100-c3)-1;
ff1 = qq3*dd-uu;
ff2 = ff1/qq3;
f3 = Min(ff1,ff2);
LL = Close + f3*(pds-1)/2;
LL = IIf(LL>C,floor(LL*rf),ceil(LL*rf))/rf;
Plot(UL,"",colorRed,1);
Plot(MM,"",colorWhite,32);
Plot(LL,"",colorGreen,1);
Cbr = IIf(UL<C,27,IIf(LL>C,32,IIf(MM>C,11,8)));
PlotOHLC(O,H,L,C,"",cbr,styleCandle);
pema=Param("Per",3,1,10,1);
Buy=Cross(EMA(C,pema),mm);
Sell=Cross(mm,EMA(C,pema));
shape=Buy*shapeUpArrow+Sell*shapeDownArrow;
PlotShapes( shape, IIf( Buy, colorGreen, colorRed ), 0, IIf( Buy, L-2, IIf(Sell,H+2,Null)));
Title = Name() + " - RSI(" + WriteVal(pd,0.0) + ") - Close=" + WriteVal(Close,0.3) + " UL=" + WriteVal(UL,0.4) + " MM=" + WriteVal(MM,0.4) + " LL=" + WriteVal(LL,0.4);_SECTION_BEGIN("Price");
SetChartOptions(0,chartShowArrows|chartShowDates);
_N(Title = StrFormat("{{NAME}} - {{INTERVAL}} {{DATE}} Open %g, Hi %g, Lo %g, Close %g (%.1f%%) {{VALUES}}", O, H, L, C, SelectedValue( ROC( C, 1 ) ) ));
Plot( C, "Close", ParamColor("Color", colorBlack ), styleNoTitle | ParamStyle("Style") | GetPriceStyle() );
_SECTION_END();


