A brief study on nifty options for intraday

This study was helpfull to me to decide whether to go for a BUY or SELL in intraday .


  • Total voters
    4
#51
one more noob question TP bhai, what kind of order is best in 3m TF. i am using market order to BUY and SELL, is there any other type of order preferred like LIMIT, BRACKET. do you have any personal experiences in those type of orders? one more thing, market order will get executed 100% at all cost. what about LIMIT and BRACKET, do these orders get executed because they are for specific price and if this price pass order wont get placed. did you had any experience in this.
I don't use Bracket orders. Market order (0 price) are extremely rare. I place limit order around my ema. I place more than one order.

Suppose the 21ema on 3 min for 43700CE is at 161, then I would place 3 buy orders at 162, 161 and 160.

Again, this is general. Day trading does not really have any fixed rules.
 

bunti_k23

Well-Known Member
#52
I don't use Bracket orders. Market order (0 price) are extremely rare. I place limit order around my ema. I place more than one order.

Suppose the 21ema on 3 min for 43700CE is at 161, then I would place 3 buy orders at 162, 161 and 160.

Again, this is general. Day trading does not really have any fixed rules.
I am wondering how much secs you need to place 3 orders? since price moves rapidly in fraction of secs....all in all we want just one click and accurate price execution. did you gave any thought for this manual thing? this execution will make a big difference. any experience with algo s? i am trying to make complete mechanical entry but i am noob in coding, have to learn some coding stuff also i think this algo/mechanical entry s dont have any common sense. for e.g in below chart i have one entry rule and i am not able to code it.

1692264380153.png
 

bunti_k23

Well-Known Member
#53
in addition to this one more thing i noticed is the expiry to trade. Since we are looking at the Nifty cash or future chart and taking trade on their options. what we want is options chart should behave as per nifty chart. today i am just monitoring these charts below, trying to find similiar candles that of nifty charts. i will check these more and try to find stable expiry with good volumes.

A quick look for volumes for today, looks like monthly expiry has best stability with good volumes. while current expiry is very volatile with highest volumes. what we want is stability with good volumes. charts are current expily 17aug, next expiry 24aug and monthly expiry of 31aug.

1692264971797.png


1692264784006.png
 
Last edited:
#55
Actually the order entry does not take much time.

Press + to activate the buy window, type 162 ENTER, 161 ENTER, 160 ENTER.

The cursor is placed in the Price field by default, the window does not close after pressing ENTER (user preferences in NEST).

So, 7 keystrokes for placing 3 buy orders.

For sell, type - (activate sell window) and type 168 ENTER.

The quantity is preset in the NEST user preferences.
 

bunti_k23

Well-Known Member
#56
Successfully reduced number of signals average per day to 5 on 3M TF. Also filtered failed trades.....now need to again backtest with historical data;).
 
Last edited:

bunti_k23

Well-Known Member
#57
Has anyone done this kind of backtesting:DD. I think i am the only Fool here:confused:. what are your thoughts on this?

I have almost a year of Ieod data for nifty. As of now I just finished 1-2 months, i will be doing this on atleast 6-7 months of data more. Lets see the results. Hope for good;)


The backtesting I am doing is based on trading behaviour which i have came across in 4 days of trading. i am applying same method of taking trades on backtesting also with same risk apetite. Looks like i have successfully reduced number of trades per day and their accuracy. Market will wait for me to trade:D See you market.
 

Attachments

VJAY

Well-Known Member
#58
Has anyone done this kind of backtesting:DD. I think i am the only Fool here:confused:. what are your thoughts on this?

I have almost a year of Ieod data for nifty. As of now I just finished 1-2 months, i will be doing this on atleast 6-7 months of data more. Lets see the results. Hope for good;)


The backtesting I am doing is based on trading behaviour which i have came across in 4 days of trading. i am applying same method of taking trades on backtesting also with same risk apetite. Looks like i have successfully reduced number of trades per day and their accuracy. Market will wait for me to trade:D See you market.
Better put backtest data in excell sheet which help you more to easily analyse your trades and you will get many hits from it
 

bunti_k23

Well-Known Member
#59
Better put backtest data in excell sheet which help you more to easily analyse your trades and you will get many hits from it
Thanks for suggestion:), will put all this data in excel now.
 

bunti_k23

Well-Known Member
#60
Completed manual backtesting for almost 6 months of data, Results are looking positive. Again, there will be slightest difference when executing trades.

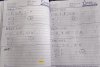
NT - SIGNAL NOT TRADED

here the signal candle did not take the previous candle high so its a NT.

1693470226135.png


high of BUY signal candle is not broken further.

1693470348570.png


Lets assume 20% error on below data .

Scenario - 1 - Trades without Re entry

1693469055324.png


total P = 309
total L = 124

Lets assume 20% of profitable trades are in loss. so,

total P = 247
total L = 124+67 = 191

Above data is only when the signal occured not considering Re entry. picture will change drastically while considering Re entry data. But still without Re entry i guess i have 1:1.5 RRR.

I am considering max loss per trade is 7 PTS in premium. but profit trades comes around 10-11 PTS, Lets assume 30% trades are going abv 30 PTS and more. so all in all things are looking good as per data.

NET PROFIT WITHOUT RE ENTRY = P - L.

So if there is 1 L and 1 P, for that day it is taking 0.

NET PROFIT WITHOUT RE ENTRY = 185 without 20% correction, lets take this number to 140. still its showing in positive.


Scenario - 2 - Trades with Re entry

Now, after a month i ve forgot to mention RP BIG. so i have considered it in RP.

The Rule is

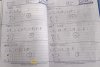
RE ENTRY CAN BE INITIATED WHEN SWING HIGH OR SWING LOW BREAKS WITH MOMENTUM

Here i have found some confusion, most of the times it was only a wick of the candle below or abv the recent swing high. so the data for Re entries will have more error. But adhering to SL most of the times Re entries gave really BIG and impressive profits. lets take 30 % error for Re entries

TOTAL profitable Re entry trades = RP + RP BIG = 249 + 9 = 258 assuming 30% error comes to 78.
= 258-78 = 180.

TOTAL loss Re entry trades = 124. lets add those 30% into Re entry loss

= 124 + 78 = 202.

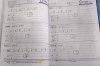
Here equation is looking little suspicious, I am having confusion whether to go for Re entries or not because of trades like these below.

1693471482883.png


1693471736916.png


1693471877046.png


1693471976041.png


1693472264364.png


1693473087828.png


In intial stage i am thinking to go without re entries. Any suggestion from you guys over this?
 

Similar threads