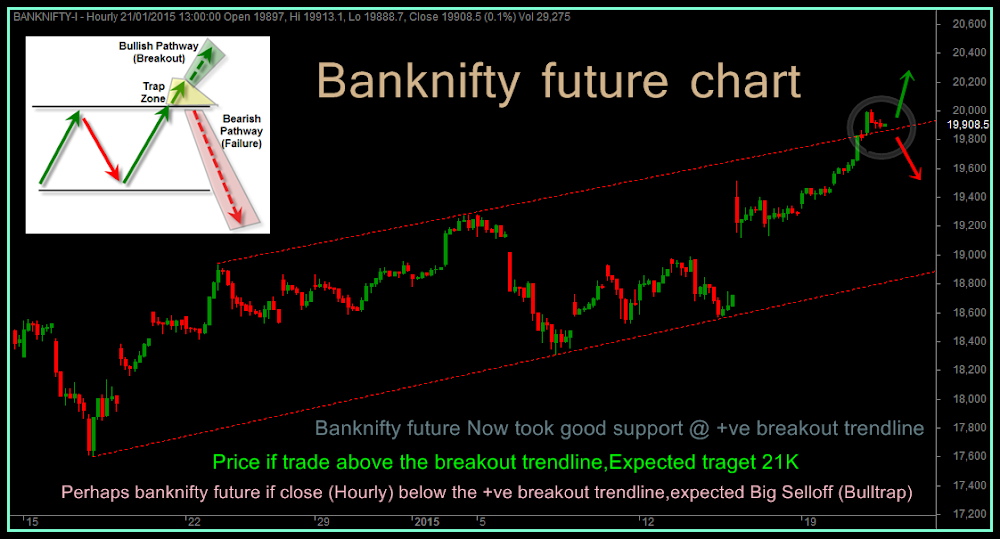
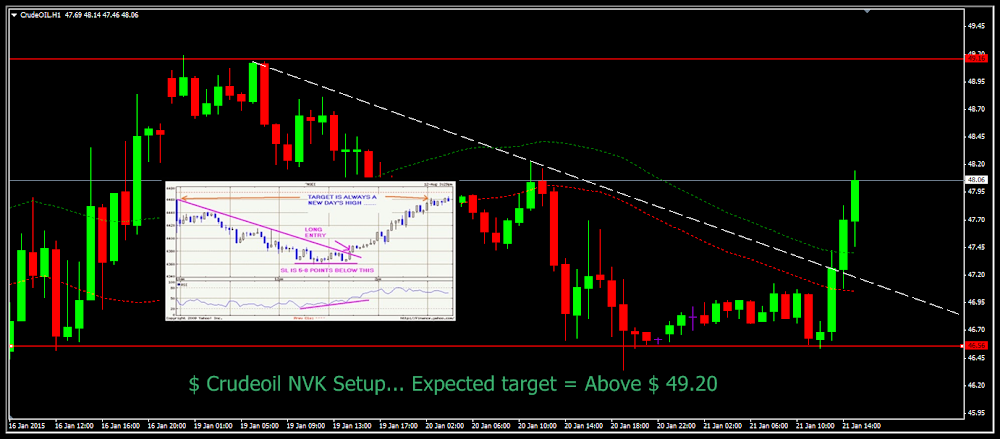
Dear santoshji, in all your chart there is two line, can you tell me what is that & which time period you use for trade.
One more thing it is possible to teach us online ?
Thanks::thumb:
Even though santoshji will answer in entirely, I'll just answer few things I know.
The line you see in his chart are called TRENDLINES and they are the basic building block of Teachnical analysis. You can google them to learn more about them.
As for time frame, it depends on individual....for instance for short to medium term traders with a holding period ranging from few days to few months I'd say go with 4hour, daily and weekly timeframes. In these TFs the movements will be substantial and noise will be less => fewer whipsaws but also fewer trading opportunities.
However if you're a long term positional trader then focus on monthly/weekly charts.
Hope it helps.


