Banknifty 2 b pattern target : 9150 ???

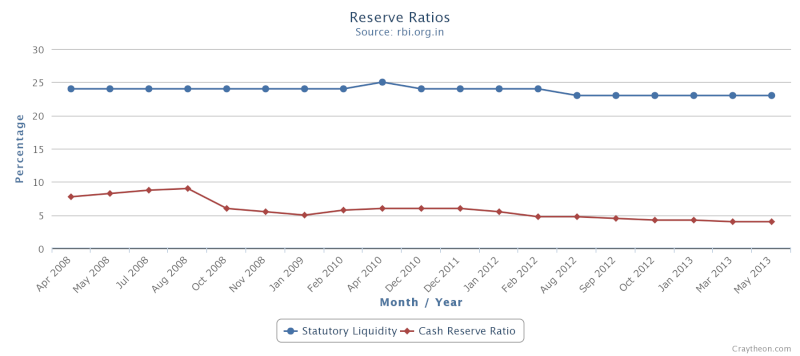
Portfolio hedging with stock beta


PORTFOLIO HEDGING WITH STOCK BETA

How to reduce risk in your portfolio, to protect favorite stocks, that you are not ready to exit and want to hold for long term.

Hedging with beta
Beta of stock is the measure of volatility of that stock in relation to the market/index. Beta more than 1 means, that stocks movement will be more than the index(up/down).

Imagine your portfolio worth 10 lakhs and you want to be immune from the correction thats going to happen.

Example for beta hedging

Portfolio value = 1000000 ( 10 lakhs)

Beta value of Portfolio = 1.2

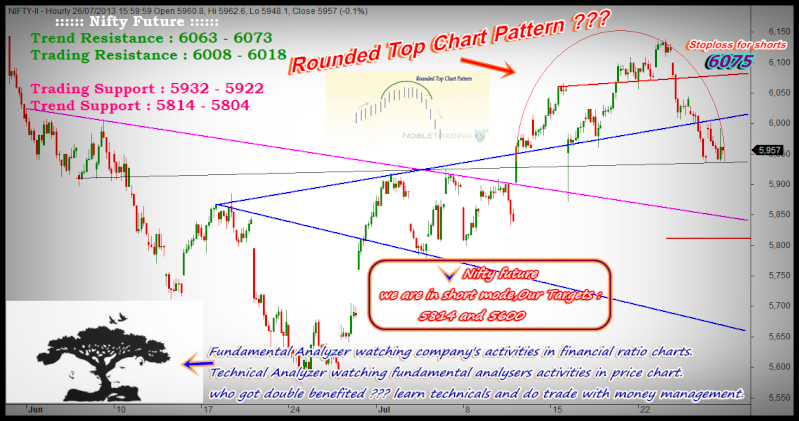
Imagine Nifty currently trading at 6000.

As beta value is 1.2, for every 1 % change in nifty there will be 1.2% change in value of your portfolio.


Hedging method with Nifty future

Worth of index, needed to sell = (1000000 X 1.2) = 1200000 ( 12 lakhs)

That means to hedge a 10 lakhs worthing portfolio, with 1.2 beta , you need to sell nifty index that worths 12 lakhs.

Means (1200000/6000) = 200 nifty,

Lot size of nifty = 50 , so 200/50 = 4, you need to sell 4 lots of nifty future.

This is not the most accurate method to neutralize your portfolio, because there will be changes in beta, well this is a useful method to reduce losses and sit safe in short term prospective .
 
NIFTY FUTURE ANALYSIS 29/JUL/2013 [vimalraj]


Jul 30, 2013
RBI First Quarter Review of Monetary Policy 2013-14


Last edited:
 
Nifty future analysis 30/jul/2013 [vimalraj]

 
missed

 
Last edited:
Nifty future analysis 31/jul/2013 [vimalraj]


Without technical charts, you cannot perform foreign exchange technical analysis. Technical charts are the essence of the purely objective way of predicting market trends. You study these charts to find patterns that could predict the rise and fall of a index value. But how do you use technical charts? Here are 5 steps you must use to do so effectively:

Step one: Choose the right type of chart.

Unless you are studying someone else’s chart, you have to create your own. When you do that, you are able to really study the raw data. You know where the data are from and whether they are accurate or not. You have to choose a chart that will best satisfy what you are looking for. You can use a computer to create your chart. There is even a choice of different charts. All you need to do is use a foreign exchange technical analysis software.

Step two: Plot the points.

Once you have chosen the chart, you can now plot the points. As with picking the type of chart, you can also use the software to plot the points presented in the chart. Make sure that you are closely following the raw data that you have collected.

Step three: Find the trends.

Once all the points have been plotted, it is time for you to look at peaks and valleys in the charts. These ups and downs will be forming patterns over time. Look for trends that form from recurring ups and downs. But do not just look at these points–it is best that you mark those points for later analysis. Use vertical or diagonal lines to mark important trends that you have found. You may also draw trends line, which are lines drawn through the major low points.

Step four: Find points of support and resistance.

So what do these support and resistance mean in the world of positional trading? Well, support refers to a barrier that prevents a value from falling. In contrast, resistance refers to a barrier that prevents a value from rising. You must then mark down points of support and resistance, since a lot of buying and selling at a certain value is what is causing the support or resistance. Mark the barriers with horizontal lines.

Step five: Finalize the market predictions.

Now, it is time for you to look back at the chart that you have created and plotted. Take note of all the patterns and the points of support and resistance. Based on those patterns and points, you may already finalize your market predictions. Once you have predicted what could happen on the next trading day, week or month, depending on the period that you have been studying, you can already decide on your move. Of course, you should also come back to study your charts again after you have your results based on your next trading move.

Technical charts eliminate the need for guess work, but work on the assumption that trading history repeats itself. They also do not follow the idea that currency values can be affected by other factors, such as sudden death of a leader, breakout of war, or unprecedented financial crisis.


Want to Learn More Median line study ?

http://www.mediafire.com/view/yjfsdmffpnf0noc/ml_research_ebook.pdf
 
Nifty future analysis 01/aug/2013 [vimalraj]


Pin Bars Pattern

A pin bar is actually a candlestick pattern where the main body of the candle is very small with a long wick. The wick of the pin bar is two to three times the size of its body. Pin bar formations assist traders to find reversal setups for exhaustive trends and fading corrective moves for trend continuation setups.

Pin bars are also referred to as hammers/ hanging man and shooting stars. There are two types of pin bars namely: the bearish pin bar and the bullish pin bar. The bearish pin bar occurs after an uptrend and has a head with the real body and a long upper shadow.
Figure 1: Showing a bullish pin bar and a bearish pin bar


The color of the head can either be red or green and/or white or black depending on your bar chart. Bullish pin bars that have a bull close will be much stronger reversal signals than those with a bear close. Vice versa for a bearish reversal pin bar.
Figure 2: Showing a bullish pin bar in an uptrend and a bearish one in a downtrend


The bullish reversal pin bars are great indicators of the incoming profitability of the market while the bearish reversal pin bars signify the losses of the market. Acquaintance with pin bars will enable a price action trader to identify potential reversals and/or signifying a continuation depending upon the type and location.

Pin bars also occur at correction levels and main market turning points; including the falling trends, rising trends and range bound environments. Pin bars are most accurate trading indicators when they are joined with high support or resistance levels, main trend ratification, and clear formation.

Traders can make entries, exits and place stop-losses in the market simply by following the pin bars and how they form. They can enter a bullish or bearish pin bar as it breaks either the high or low of the real body depending on the direction of trading.

An effective pin bar trading strategy is vital to price action trading for identifying high probability setups. The pin bar can be traded on any time frame and from appropriate price action support and resistance levels.


How to Profit with Pin Bars

What are pin bars? Pin bars are single-candlestick reversal patterns. In other words, they are candlestick patterns which are made up of one single candle, often appearing at the top of a trend or at the bottom of a trend.

Pin bars are formed when there is a foregoing trend, and the pin bar candle opens and moves in the direction of the previous trend, only for traders in contrary positions to enter the market and drive the price of the asset in the opposite direction. The result is a candle that looks like a lollipop, with a long shadow, a short body oriented towards one end of the candle, and a short shadow on the other side of the body. The pin bar candlesticks are also known forex as:

a) * * *Hammer
b) * * *Hanging man
c) * * *Inverted hammer
d) * * *Shooting star

The hammer and inverted hammer are bullish reversal pin bars, while the shooting star and hanging man are bearish reversal pin bars.

Pin bars are very important price action patterns because their appearance is a signal that the sentiment in the market has changed, and that it may be time to unwind previous positions and take up new ones in the opposite direction (read this article for more on this).

The signals given by pin bars are not always accurate if you don’t really understand them in the context of the prior price action. For this reason, traders must use a means of confirmation or signal filtering to increase the accuracy of the pin bar signal. *But when combined with the right information and price action, they can be powerful signals and great way to enter the market.

Trading with Pin Bars

The process of trading with pin bars is simple.

a) * * *Identify the current trend.
b) * * *Identify the pin bar.
c) * * *Combine the pin bar with a method of trade confirmation (i.e. at key support and resistance areas, at event areas, pullbacks to the 20ema, etc)
d) * * *Execute the trade either at the open or on a 50% retracement of the pin bar

It is not usually hard to identify the current trend. Simply looking at the chart and the direction of the price movement will indicate what the trend has been. *You can also look for impulsive and corrective price action.

Identifying the pin bar is the next step. A true pin bar can be recognized by the following characteristics:

a) * * *It has a short body
b) * * *It must have a long shadow on the end that is opposite the direction of the trend, in the direction of the reversal
c) * * *The pin bar should ideally have a closing price that is lower than the open price for a bearish reversal pin bar, and close above the candle open if the pi nbar is a bullish reversal pin bar.

Only pin bars located at either end of the trend should be used. Pin bars occurring at areas of market consolidation or in the middle of a trend will not produce good trading opportunities.

Once the pin bar occurrs at the top or bottom of a trend, and has been identified, it is time to combine the pin bar with a method of trade confirmation. One of the best methods of trade confirmation is by checking to see if the pin bar is at a strong region of support or resistance where price action has had a strong reaction in the past. *You can call these event areas, or areas of impulsive price action.

On intraday price action trading, using pivot points for the day works pretty consistently. All a trader needs to do is to download an automatic pivot point tool, apply it to the chart, and the key levels of support and resistance will be displayed.

Typically, the opportunity is to look for where a bearish pin bar forms on a resistance (R1, R2, R3) or where a bullish pin bar is on a support (S1, S2, S3). These are shown in the charts below:


Cnxit weekly chart update 01/aug/2013


CNXIT ~ Top 10 constituents by weightage

Company’s NameWeight (%)
Infosys Ltd. 47.76
Tata Consultancy Services Ltd. 30.67
HCL Technologies Ltd. 8.14
Tech Mahindra Ltd. 2.84
Oracle Financial Services Software Ltd. 2.25
MphasiS Ltd. 1.08
Vakrangee Software Ltd. 1.04
MindTree Ltd. 0.97
CMC Ltd. 0.76
Hexaware Technologies Ltd. 0.74
 

Similar threads