best rsi,stochastic and macd setting for 5 min chart

#11

Its pretty simple, as the standard rules of entry using RSI, Stoch apply.
Moving averages are used to determine supports and/or resistances.
This is my holy grail.
Now only working on divergences, which is much related to realtime chart viewing and cannot be learned from any book.
But remember these settings are for 15 min chart and higher
thanks for posting. please u can explain, more clearly rule to enter and exit. e.g. rsi and stoch value to enter and to exit and at the same time values of moving averages. in nutshell. if possible by chart.
 

sumeetsj

Well-Known Member
#13
hi Sumeet,

please share the holy grail with us...!!!
can someone please help with intraday setup. and hw to go about it.

thanks


Brother there is "NO" holy grail.
to put it in simple words, ask yourself this question:

"Would be able to bat like Dhoni if i use his cricket bat ? "

you will get the answer.
Intraday setup i have already shared.
Dig deeper in the forum and u will get more.
(Many things i have learnt from here myself)
 
#15
MACD setting for Intraday in Trade Tiger

which setting of MACD work at 5min / 15min chart in Trade Tiger

AVG Type : .........
AVG Period : .........

Short Type : .......
Short Period : ...........

Long Type : .......
Long Period : ...........
 

johnnypareek

Well-Known Member
#16
Re: MACD setting for Intraday in Trade Tiger

which setting of macd work at 5min / 15min chart in trade tiger

avg type : .........ema
avg period : .........7

short type : .......ma
short period : ...........8 or 9

long type : .......ma
long period : ...........17 or 21

chk these on old data before entering as im out of station n can't give u eject.
 
#17
Hi everyone:)
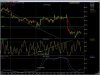
This is the best stochastic tool for intraday 5min settings

"Avg type E"
"Avg Period 14"
"%K Period 80"
"% k/D Slow 9"

This setting is to know the intraday trend. If its moving up above 20 that means going to be uptrend and below 70 means going to fall. along with this can add another stochastic to know the timeline when to take the trade. The setting are as follows

"Avg type E"
"Avg Period 2"
"%K Period 8"
"% k/D Slow 2"

80 over bought (Sell)
20 over sold (buy)

u will find at least one or two Divergens

i have attached the sample. this is my 2 years experience i have created this after going to huge lose finally i got this and all my friends are trading with good profit
I bet u all, this will work. Happy Trading:thumb:
 

Attachments

columbus

Well-Known Member
#19
Hi Columbus,

Can RSI 40,60 be for intraday for 5 min chart.? I usually look for Divergence below/above these levels.
Hi jatin,

The universal ratio of RSI (70:30.......overbought:eek:versold) is also good for
TF of 4min.(personal choice)
 
#20

Similar threads