


BollingerWorm !!!
- Thread starter columbus
- Start date

EOD-7/6/13
===========
1.Use standard Bollinger Bands ,that is, bb(20,2).
2.Use ema2-HIGH and ema2-LOW to outline the body of the worm.
3.If the body comes out of bands & re-enters ,then make an ENTRY.
4.The EXIT is, if body comes out the other band and re-enters the body.
5.In case of extreme Bullishness/extreme Bearishness another
pair is used pertaining to BB(20,1) or just for guidance in normal case also.
6.If candles are sandwiched between OUTER of BB(20,1) and INNER band
BB(20,2) then ride the trend .
7.If either ema-2H or ema-2L is cut twice by either BB(20,2),BB(20,1) or
SMA-20 in quick succession ,it indicates a END of a trend.
8.Continuation is indicated if both ema-2H and ema-2L are cut by SMA-20
and/or BB(20,1) and/or BB(20,2).
9.If the trade goes against you and if the divisions on Y-axis is not more
than 10,in that case you can add ONE or TWO trades, at least 5or 10 points apart.
(Or as per the volatility on that day)
EOD-14/6/13
===========
1.Use standard Bollinger Bands ,that is, bb(20,2).
2.Use ema2-HIGH and ema2-LOW to outline the body of the worm.
3.If the body comes out of bands & re-enters ,then make an ENTRY.
4.The EXIT is, if body comes out the other band and re-enters the body.
5.In case of extreme Bullishness/extreme Bearishness another
pair is used pertaining to BB(20,1) or just for guidance in normal case also.
6.If candles are sandwiched between OUTER of BB(20,1) and INNER band
BB(20,2) then ride the trend .
7.If either ema-2H or ema-2L is cut twice by either BB(20,2),BB(20,1) or
SMA-20 in quick succession ,it indicates a END of a trend.
8.Continuation is indicated if both ema-2H and ema-2L are cut by SMA-20
and/or BB(20,1) and/or BB(20,2).
9.If the trade goes against you and if the divisions on Y-axis is not more
than 10,in that case you can add ONE or TWO trades, at least 5or 10 points apart.(Or as per the volatility on that day)
EOD-21/6/13
===========
1.Use standard Bollinger Bands ,that is, bb(20,2).
2.Use ema2-HIGH and ema2-LOW to outline the body of the worm.
3.If the body comes out of bands & re-enters ,then make an ENTRY.
4.The EXIT is, if body comes out the other band and re-enters the body.
5.In case of extreme Bullishness/extreme Bearishness another
pair is used pertaining to BB(20,1) or just for guidance in normal case also.
6.If candles are sandwiched between OUTER of BB(20,1) and INNER band
BB(20,2) then ride the trend .
7.If either ema-2H or ema-2L is cut twice by either BB(20,2),BB(20,1) or
SMA-20 in quick succession ,it indicates a END of a trend.
8.Continuation is indicated if both ema-2H and ema-2L are cut by SMA-20
and/or BB(20,1) and/or BB(20,2).
9.If the trade goes against you and if the divisions on Y-axis is not more
than 10,in that case you can add ONE or TWO trades, at least 5or 10 points apart.
(Or as per the volatility on that day)
EOD-28/6/13
===========
1.Use standard Bollinger Bands ,that is, bb(20,2).
2.Use ema2-HIGH and ema2-LOW to outline the body of the worm.
3.If the body comes out of bands & re-enters ,then make an ENTRY.
4.The EXIT is, if body comes out the other band and re-enters the body.
5.In case of extreme Bullishness/extreme Bearishness another
pair is used pertaining to BB(20,1) or just for guidance in normal case also.
6.If candles are sandwiched between OUTER of BB(20,1) and INNER band
BB(20,2) then ride the trend .
7.If either ema-2H or ema-2L is cut twice by either BB(20,2),BB(20,1) or
SMA-20 in quick succession ,it indicates a END of a trend.
8.Continuation is indicated if both ema-2H and ema-2L are cut by SMA-20
and/or BB(20,1) and/or BB(20,2).
9.If the trade goes against you and if the divisions on Y-axis is not more
than 10,in that case you can add ONE or TWO trades, at least 5or 10 points apart.
(Or as per the volatility on that day)
EOD-5/7/13
===========
1.Use standard Bollinger Bands ,that is, bb(20,2).
2.Use ema2-HIGH and ema2-LOW to outline the body of the worm.
3.If the body comes out of bands & re-enters ,then make an ENTRY.
4.The EXIT is, if body comes out the other band and re-enters the body.
5.In case of extreme Bullishness/extreme Bearishness another
pair is used pertaining to BB(20,1) or just for guidance in normal case also.
6.If candles are sandwiched between OUTER of BB(20,1) and INNER band
BB(20,2) then ride the trend .
7.If either ema-2H or ema-2L is cut twice by either BB(20,2),BB(20,1) or
SMA-20 in quick succession ,it indicates a END of a trend.
8.Continuation is indicated if both ema-2H and ema-2L are cut by SMA-20
and/or BB(20,1) and/or BB(20,2).
9.If the trade goes against you and if the divisions on Y-axis is not more
than 10,in that case you can add ONE or TWO trades, at least 5 or 10 points apart. (Or as per the volatility on that day)
EOD-12/7/13
===========
1.Use standard Bollinger Bands ,that is, bb(20,2).
2.Use ema2-HIGH and ema2-LOW to outline the body of the worm.
3.If the body comes out of bands & re-enters ,then make an ENTRY.
4.The EXIT is, if body comes out the other band and re-enters the body.
5.In case of extreme Bullishness/extreme Bearishness another
pair is used pertaining to BB(20,1) or just for guidance in normal case also.
6.If candles are sandwiched between OUTER of BB(20,1) and INNER band
BB(20,2) then ride the trend .

7.If either ema-2H or ema-2L is cut twice by either BB(20,2),BB(20,1) or
SMA-20 in quick succession ,it indicates a END of a trend.
8.Continuation is indicated if both ema-2H and ema-2L are cut by SMA-20
and/or BB(20,1) and/or BB(20,2).
9.If the trade goes against you and if the divisions on Y-axis is not more
than 10,in that case you can add ONE or TWO trades, at least 5 or 10 points apart. (Or as per the volatility on that day)
===========
1.Use standard Bollinger Bands ,that is, bb(20,2).
2.Use ema2-HIGH and ema2-LOW to outline the body of the worm.
3.If the body comes out of bands & re-enters ,then make an ENTRY.
4.The EXIT is, if body comes out the other band and re-enters the body.
5.In case of extreme Bullishness/extreme Bearishness another
pair is used pertaining to BB(20,1) or just for guidance in normal case also.
6.If candles are sandwiched between OUTER of BB(20,1) and INNER band
BB(20,2) then ride the trend .
7.If either ema-2H or ema-2L is cut twice by either BB(20,2),BB(20,1) or
SMA-20 in quick succession ,it indicates a END of a trend.
8.Continuation is indicated if both ema-2H and ema-2L are cut by SMA-20
and/or BB(20,1) and/or BB(20,2).
9.If the trade goes against you and if the divisions on Y-axis is not more
than 10,in that case you can add ONE or TWO trades, at least 5 or 10 points apart. (Or as per the volatility on that day)
As recommended, by you in the BB thread, I am now trying to wrap my head around the use of EMA bands.....I hope I understood it correctly
The EMA 2H and EMA 2L are plotted in a pink/purple color. I hope its visible in the image. Its the EOD data for Adani Enterprise, 16th July 2013....
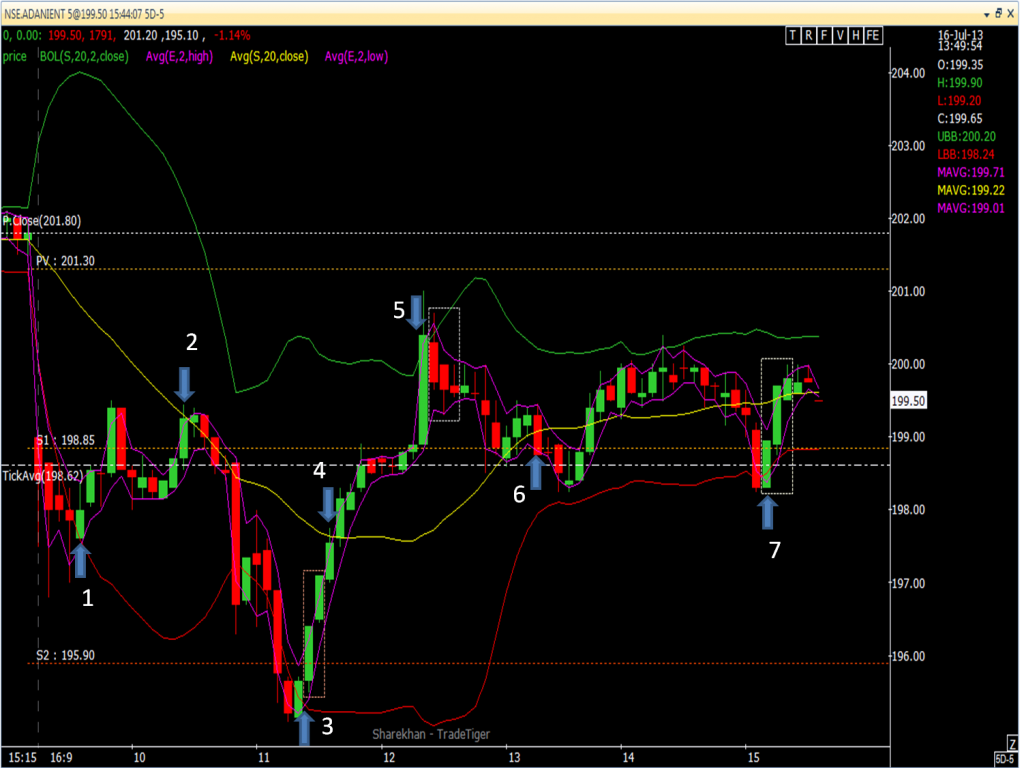
1) After a gap down start and some red candles below the bottom BB bar, finally a green bar with the EMA band cutting the lower BB line. Entry point for a long position..
2) As per our discussion in the BB thread, the center line is to be treated as a resistance / support line. The first green candle cutting the center SMA 20 line is an exit point. Wait for the next candle to form, after setting a trailing stop loss. If there is no new high in the next candle, square off and exit long position.
3) The EMA 2L line goes below the bottom BB line and returns above the bottom BB line with the formation of the green candle. Another buy signal for a long position...
4) Ready to exit long position, but since a new high is formed in next candle, hold position with trailing stop loss...
5) Top BB line is cut by green candle, square off long position...
With the formation of
a) the red candle immediately after the green candle
b) the EMA band going back into the BB zone
Entry point for short position....
6) Cuts center SMA 20 line, ready to exit short position, wait for new lows in subsequent candles. Exit short a few candles after that
Note: The ideal exit for the short would have been the needlike red candle before 13:00 which nearly touched the SMA 20 line.....
7) Another opportunity for long position, but it is after 15:00, not a good time I would assume....
Did I get it right...or have I made some blunders along the way ??
The EMA 2H and EMA 2L are plotted in a pink/purple color. I hope its visible in the image. Its the EOD data for Adani Enterprise, 16th July 2013....
1) After a gap down start and some red candles below the bottom BB bar, finally a green bar with the EMA band cutting the lower BB line. Entry point for a long position..
2) As per our discussion in the BB thread, the center line is to be treated as a resistance / support line. The first green candle cutting the center SMA 20 line is an exit point. Wait for the next candle to form, after setting a trailing stop loss. If there is no new high in the next candle, square off and exit long position.
3) The EMA 2L line goes below the bottom BB line and returns above the bottom BB line with the formation of the green candle. Another buy signal for a long position...
4) Ready to exit long position, but since a new high is formed in next candle, hold position with trailing stop loss...
5) Top BB line is cut by green candle, square off long position...
With the formation of
a) the red candle immediately after the green candle
b) the EMA band going back into the BB zone
Entry point for short position....
6) Cuts center SMA 20 line, ready to exit short position, wait for new lows in subsequent candles. Exit short a few candles after that
Note: The ideal exit for the short would have been the needlike red candle before 13:00 which nearly touched the SMA 20 line.....
7) Another opportunity for long position, but it is after 15:00, not a good time I would assume....
Did I get it right...or have I made some blunders along the way ??
Hi raasaa,
Thanks for good graph.
You grasped the strategy and logic behind it ,quite marvelously.
You missed 2 Points.
1.You can draw the chart without candles also.(Black candles)
2.Draw another Bollinger Band BB(20,1).
Because it based on the behaviour of TREND (which is given by the pair of EMA-2L and EMA-2H) at BB(20,1) and SMA-20.
BULLISH TREND
BB(20,2)LOW...>BB(20,1)LOW...>SMA-20...>BB(20,1)TOP...>BB(20,2)TOP
BEARISH TREND
BB(20,2)TOP...>BB(20,1)TOP...>SMA-20...>BB(20,1)LOW...>BB(20,2)LOW

Yes,it is not a wise idea to take new position after 15.00.If you have any
positions ,which are inline with the TREND you can ride.
Looking at the graph ,trading appears to be a child's play but on a LIVE
chart it is difficult.
Thanks for good graph.
You grasped the strategy and logic behind it ,quite marvelously.
You missed 2 Points.
1.You can draw the chart without candles also.(Black candles)
2.Draw another Bollinger Band BB(20,1).
Because it based on the behaviour of TREND (which is given by the pair of EMA-2L and EMA-2H) at BB(20,1) and SMA-20.
BULLISH TREND
BB(20,2)LOW...>BB(20,1)LOW...>SMA-20...>BB(20,1)TOP...>BB(20,2)TOP
BEARISH TREND
BB(20,2)TOP...>BB(20,1)TOP...>SMA-20...>BB(20,1)LOW...>BB(20,2)LOW
Yes,it is not a wise idea to take new position after 15.00.If you have any
positions ,which are inline with the TREND you can ride.
Looking at the graph ,trading appears to be a child's play but on a LIVE
chart it is difficult.