columbus,
You may find following article interesting.
Inside Day Bollinger Band Turn Trade
January 01 2010 | Filed Under Forex , Forex Technical Analysis , Forex Trading Strategies , Forex-Advanced Email
Print
Reprints
Feedback
We have long been taught that to be a successful trader, your objective should be to buy low and sell high or buy high and sell higher (and vice versa for shorts). Different strategies approach this most basic definition of speculation in various ways. Trend traders look to buy strength on the breakout and sell weakness on the breakdown. Good trend traders can make great sums of money in the long term with just a few big winners. However, most find applying trend trading far more difficult than the theory behind it. Simply stated, the human brain is not wired to trade trends.
For example, buying the breakout in GBP/USD at 1.8000 (after it had bottomed at 1.7229 34 weeks earlier) and holding until 1.9000 sounds great, but human tendency makes it difficult to buy something at what is perceived as a high price (such as 1.8000). Furthermore, false breakouts will whipsaw a trader out of many trades - it simply isn't an efficient way to trade. On the other hand, traders that attempt to pick bottoms and tops usually get blown out of the water because they either do not have a method or they fail to follow their method - the end result is akin to attempting to stop a freight train by standing in front of it. Traditional trend trading (buying and selling breakouts) seems far too challenging from a psychological point of view, but for a novice trader, picking tops and bottoms at the same time is simply dangerous. What we need is a relative definition of high and low and a filter to help identify proper top and bottom trades. In this article we'll take a look at the inside day Bollinger band, which can help objectively measure what is high and low. (For more background, check out The Basics Of Bollinger Bands.)
Advertisement - Article continues below.
Combining Inside Days with Bollinger Bands
Prices at the upper Bollinger band are considered high and prices at the lower Bollinger band are considered low. However, just because prices have hit the upper Bollinger does not necessarily mean that it is a good time to sell. Strong trends will 'ride' these bands and wipe out any trader attempting to buy the 'low' prices in a downtrend or sell the 'high' prices in an uptrend. Therefore, just buying at the lower band and selling at the upper band is out of the question. By definition, price makes new highs in an uptrend and new lows in a downtrend, which means that they will naturally be hitting the bands. With this information in mind, our filter will require that buy signals occur only if the candle following the one that hits the Bollinger band does not make a new high or low. This type of candle is commonly known as an inside day. The best time frames to look for the inside days are daily charts, but this strategy can also be used on hourly, weekly and monthly charts. Combining inside days with Bollinger bands increases the likelihood that we are only picking a top or bottom after prices have hit extreme levels. As a rule of thumb, the longer the time frame, the rarer the trade will be, but the signal will also be more significant. (For more insight, see Using Bollinger Band "Bands" to Gauge Trends and Capture Profits With Bands And Channels.)
Learn to trade Forex with FXCM’s Free Trading Guide
Candlesticks and their respective patterns illustrate the psychology of the market at a particular point in time. Specifically, the inside candle represents a period of contracted volatility. If, in an uptrend, volatility begins to slow and the market fails to make a new high (as illustrated by the inside candle), then we can deduce that strength is waning and that the chance for a reversal exists. When combined with a Bollinger band, we ensure that we are trading a reversal only by either selling high prices (higher Bollinger band) or buying low prices (lower Bollinger band). In this way, we trade for the big move; not necessarily selling the low tick or buying the bottom tick but definitely buying near the relative bottom and selling near the relative top. The key is confirmation.
Since Bollinger bands typically use a length of 20, we can employ a 20-period simple moving average (SMA) as a target to take profit. The 20-period SMA will trade equidistant from the upper and lower Bollinger bands. To catch large moves, allow the pair to trade through the 20-period SMA and then trail your stop with the moving average, only closing trades on the close after the pair crosses the SMA again. The examples below will shed light on this process.
Four Guidelines
We have four guidelines. We'll call these guidelines (rather than rules) because this is a strategy that involves discretion. The guidelines present a trade setup that may or may not result in a trade.
For longs:
1. Look for the currency pair to hit or come very close to hitting the lower Bollinger.
2. Wait for next candle and make sure that the next candle's low is greater than or equal to the previous candle's low and that the high is also less than or equal to the previous period's high. If so, go long at the open of the third candle.
3. The initial stop is placed a few pips below the previous candle's low.
4. Trail stop on a closing basis with the 20-period SMA.
For shorts:
1. Look for the currency pair to hit or come very close to hitting the upper Bollinger.
2. Wait for next candle and make sure that the next candle's high is less than or equal to the previous candle's high and that the low is also greater than or equal to the previous period's low. If so, go short at the open of the third candle.
3. The initial stop is placed a few pips above the previous candle's high.
4. Trail stop on a closing basis with the 20-period SMA.
Now let's explore some examples:
The first example is a short EUR/USD trade on daily charts. In Figure 1, we see that the price hits the upper Bollinger, we wait for an inside day to form where the high and low of the candle is engulfed by the previous candle. Once we see that, we enter short on the following candle at 1.2144 on March 21, 2006. We remain in the position and trail our stop on a closing basis by the 20-period SMA. The trade is eventually closed on March 24, 2006, at 1.2035 for a gain of 109 pips.
Life insurance as low as $14/mo for $250,000 or $21/mo for $500,000 of coverage. Contact MetLife
Figure 1 - Short EUR/USD trade on daily charts
The next example is a short GBP/USD trade. In Figure 2 we see the same scenario as the EUR/USD trade but this is far more profitable opportunity. As illustrated in Figure 2, our short trade is initiated at 1.7714 on October 31, 2005. The position is then covered on December 1, 2005 at 1.7310 for a 404 pip profit.
Figure 2 - Short GBP/USD trade
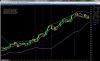
On the long side, we have USD/CAD that gave us an inside day Bollinger band signal on March 6, 2006. We went long at 1.1364. The uptrend remained intact for one month, allowing us to exit the trade at 1.1618 on April 5, 2006 for a 254 pip profit.
Figure 3 - USD/CAD
You may also notice from our examples above that our exit could be greatly improved by taking profit at the other Bollinger band. For example, on the USD/CAD trade in Figure 3, we could have taken profit on March 20 at the upper Bollinger band at 1.1680. The same can be said for the GBP/USD trade in Figure 2 - we could have covered our short position on November 16 at 1.7163 at the lower Bollinger band. In order to exit at favorable prices, a good tip is to trade two lots and take profit on one lot at the opposite Bollinger band. Trail the stop on the other lot with the 20-period SMA (as originally described). This way, you consistently book profits at favorable prices but give yourself the chance to profit from a truly remarkable move. (For more on finding profitable forex trade techniques, check out Uncover Forex Profits With The Turn Trade.)
Longer Term Charts
The inside day Bollinger band setup can also be used to identify major turns on weekly or even monthly charts for the longer-term position trader. The following examples show signals of our setup at major tops in GBP/USD (weekly chart) in Figure 4, a major bottom in EUR/GBP (weekly chart) in Figure 5 as well as well as a buy signal that indicated an all-time low in EUR/USD back in late 2000 on the monthly chart shown in Figure 6, and finally a USD/JPY sell signal in Figure 7 that was triggered in February 2002 at 133.36 on a monthly chart. In the last example, the pair closed at 119.49 just four months later!
Figure 4 - GBP/USD
Figure 5 - EUR/GBP
Figure 6 - EUR/USD
Figure 7 - USD/JPY
Benefits
There are many benefits to the inside day Bollinger band strategy. The most obvious is its simplicity. Creating a trading strategy is not rocket science, but those that treat it as such usually end up frustrated and confused and - worse still - with a losing trading record. We can easily measure risk with this strategy and place stops appropriately. In other words, we have distinct points of reference (the inside day's high and low) from which to enter the trade and place stops. The setup is dynamic, meaning that it works on all time frames. Even a short-term day trader could use it on an hourly chart. However, the shorter the time frame, the less reliable the signal. Remember that candlesticks and their patterns shine light on the psychology of the market. An hourly chart encompasses a smaller amount of market data than a daily chart. As a result, an hourly chart is not as true an indication of mass psychology as a daily chart. (For related reading, see The Art Of Candlestick Charting - Part 1, Part 2, Part 3 and Part 4.)
Conclusion
This setup is just that - a setup. The trade should be managed according to your risk parameters and your trading style. Some may prefer to sell on a retrace after a short signal occurs, while others may prefer to sell a break of a daily low after a short signal. As we mentioned above, alter the size of the trade and the exit strategy. For example, trade multiple lots (if account size permits) and take profit on one lot at the 20 SMA, take profit on another lot at the opposite Bollinger band, and trail another lot(s) with the 20 SMA. Regardless of how you choose to implement this strategy, keep in mind that the FX market is an extremely trending market, which makes it even more important for range traders to get confirmation before trying to pick tops and bottoms. Combining inside days with Bollinger bands is a simple way of waiting for confirmation before taking the trade.
Read more:
http://www.investopedia.com/articles/forex/06/BBInsideDay.asp#ixzz1qPXJ6KwV


 86.6 KB Views: 71


