Re: Can anyone please find me this afl for amibroker.......if anyone has it plz post
Dont' Go any where...
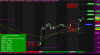
Here it is... Enjoy...
_SECTION_BEGIN("Price");
upbar = C > Ref( C, -1 );
downbar = C < Ref( C, -1 );
/* Colourized price bars drawn here */
Graph0 = Close;
Graph0Style = 128;
barcolor = IIf( downbar, 4, IIf( upbar, 5, 1 ) );
Graph0BarColor = ValueWhen( barcolor != 0, barcolor );
SetBarFillColor( IIf( Close > Open, colorGreen, colorDarkRed ) );
SetChartOptions(0,chartShowArrows|chartShowDates);
GfxSelectFont( "Tahoma", 13, 100 );
GfxSetBkMode( 1 );
GfxSetTextColor( colorWhite );
//_N(Title = StrFormat("{{NAME}} - {{INTERVAL}} {{DATE}} Open %g, Hi %g, Lo %g,Close %g (%.1f%%) {{VALUES}}", O, H, L, C, SelectedValue( ROC( C, 1 ) ) ));
Title = EncodeColor(colorWhite)+ Name() + " - " + EncodeColor(colorYellow)+ Interval(2) + EncodeColor(colorYellow) +
" - " + Date() +" - "+ EncodeColor(colorYellow) + "Open = "+EncodeColor(colorWhite)+WriteVal(O,8.2) + EncodeColor(colorYellow) + ", High = "+EncodeColor(colorWhite)+ WriteVal(H,8.2)+ EncodeColor(colorYellow) + ", Low= "+EncodeColor(colorWhite)+ WriteVal(L,8.2)+ EncodeColor(colorYellow) + ", Close= "+EncodeColor(colorWhite)+ WriteVal(C,8.2)+ EncodeColor(colorYellow) + ", Vol= "+EncodeColor(colorWhite)+ WriteVal(V,1)+("\n");
Plot( C, "Close", ParamColor("Color", colorYellow ), styleNoTitle |
ParamStyle("Style") | GetPriceStyle() );
Plot( O, "Open", ParamColor("Color", colorBlack ), styleNoDraw);
Plot( H, "High", ParamColor("Color", colorBlack ), styleNoDraw);
Plot( L, "Low", ParamColor("Color", colorBlack ),styleNoDraw);
Plot( C, "Close", ParamColor("Color", colorBlack ),styleNoDraw, ParamStyle("Style") | GetPriceStyle() );
_SECTION_END();
//Comments:
////////////////////////////////////////// DAY GRID ///////////////////////////////////////////////////////////////////////////////
//-----------------------------------------------------------------------------------------------------------------------------------
grid_day = IIf(Day()!=Ref(Day(),-1),1,0);
Plot(grid_day,"",colorWhite,styleHistogram|styleDashed|styleNoLabel|styleOwnScale);
///////////////////////////////////////////////////////////////////////////////
_SECTION_BEGIN("swing1");
messageboard = ParamToggle("Message Board","Show|Hide",0);
showsl = ParamToggle("Stop Loss Line", "Show|Hide", 0);
no=20;
res=HHV(H,no);
sup=LLV(L,no);
avd=IIf(C>Ref(res,-1),1,IIf(C<Ref(sup,-1),-1,0));
avn=ValueWhen(avd!=0,avd,1);
supres=IIf(avn==1,sup,res);
//s5d=IIf(avn==1,sup,res);
a=Cross(C,supres);
b=Cross(supres,C);
if (showsl == 0)
{
Plot(supres,"Stop Loss",colorCustom8,styleDots);
}
//Plot(supres,"Swing",colorYellow,styleStaircase);
//Plot(supres,"Swing",colorLightBlue,styleDots);
//SetChartBkGradientFill( ParamColor("BgTop", ColorRGB( 172,172,172 )),ParamColor("BgBottom", ColorRGB( 172,172,172 )),ParamColor("titleblock",ColorRGB( 172,172,172 )));
prev=AMA2(C,1,0);
//d=IIf(C>( Ref(Max(Max(H,Ref(H,-20)),Max(Ref(H,-10),Ref(H,-15))),-1) ),Min(Min(L,Ref(L,-20)),Min(Ref(L,-10),Ref(L,-15))), IIf(C<Ref(Min(Min(L,Ref(L,-20)),Min(Ref(L,-10),Ref(L,-15))),-1),Max(Max(H,Ref(H,-20)),Max(Ref(H,-10),Ref(H,-15))),PREV));
d=IIf(C>( Ref(Max(Max(H,Ref(H,-20)),Max(Ref(H,-10),Ref(H,-15))),-1) ),Min(Min(L,Ref(L,-20)),Min(Ref(L,-10),Ref(L,-15))), IIf(C<Ref(Min(Min(L,Ref(L,-20)),Min(Ref(L,-10),Ref(L,-15))),-1),Max(Max(H,Ref(H,-20)),Max(Ref(H,-10),Ref(H,-15))),PREV));
Buy=Cross(Close,d);
//a = Cross)Close,d);
Sell=Cross(d,Close);
//b=Cross(d,Close);
//state=IIf(BarsSince(a)<BarsSince(b),1,0);
Buy = ExRem(Buy,Sell);
Sell = ExRem(Sell,Buy);
//Short = ExRem(Short, Cover);
//Cover = ExRem(Cover, Short);
AlertIf( Buy, "", "BUY @ " + C, 1 );
AlertIf( Sell, "", "SELL @ " + C, 2);
for(i=BarCount-1;i>1;i--)
{
if(Buy == 1)
{
entry = C;
sig = "BUY";
sl = supres;
tar1 = entry + (entry * .0050);
tar2 = entry + (entry * .0092);
tar3 = entry + (entry * .0125);
tar4 = entry + (entry * .0192);
bars = i;
i = 0;
}
if(Sell == 1)
{
sig = "SELL";
entry = C;
sl = supres;
tar1 = entry - (entry * .0050);
tar2 = entry - (entry * .0112);
tar3 = entry - (entry * .0152);
tar4 = entry - (entry * .0212);
/*tar1 = entry - 22;
tar2 = entry - 38;
tar3 = entry - 55;*/
bars = i;
i = 0;
}
}
Offset = 3;
Clr = IIf(sig == "BUY", colorLime, colorRed);
ssl = IIf(bars == BarCount-1, supres[BarCount-1], Ref(supres, -1));
sl = ssl[BarCount-1];
Plot(LineArray(bars-Offset, tar1, BarCount, tar1,1), "", Clr, styleLine|styleDots, Null, Null, Offset);
Plot(LineArray(bars-Offset, tar2, BarCount, tar2,1), "", Clr, styleLine|styleDots, Null, Null, Offset);
Plot(LineArray(bars-Offset, tar3, BarCount, tar3,1), "", Clr, styleLine|styleDots, Null, Null, Offset);
Plot(LineArray(bars-Offset, tar4, BarCount, tar4,1), "", Clr, styleLine|styleDots, Null, Null, Offset);
Plot(LineArray(bars-Offset, sl, BarCount, sl,1), "", colorDarkRed, styleLine|styleLine, Null, Null, Offset);
Plot(LineArray(bars-Offset, entry, BarCount, entry,1), "", colorGreen, styleLine|styleLine, Null, Null, Offset);
for (i=bars; i <BarCount;i++)
{
PlotText(""+sig+"@"+entry, BarCount+1,entry,Null,colorBlue);
PlotText("T1@"+tar1,BarCount+3,tar1,Null,Clr);PlotText("T2@"+tar2,BarCount+3,tar2,Null,Clr);PlotText ("T3@"+tar3,BarCount+3,tar3,Null,Clr);PlotText ("T4@"+tar4,BarCount+3,tar4,Null,Clr);
}
state=IIf(BarsSince(Buy)<BarsSince(Sell),1,0);
s=state>Ref(state,-1);
ss=state<Ref(state,-1);
sss=state==Ref(state,-1);
col=IIf(state == 1 ,51,IIf(state ==0,4,1));
//Plot(C,"",Col,64);
PlotShapes( shapeUpArrow * s ,colorWhite,0,L, Offset=s);
PlotShapes( shapeHollowCircle * s ,colorPink,0,L, Offset=s-12);
PlotShapes( shapeHollowCircle *ss ,colorPink,0,H, Offset=s);
PlotShapes( shapeDownArrow *ss ,colorWhite,0,H, Offset=s+12);
_SECTION_END();
if (messageboard == 0 )
{
if ( sig =="BUY")
{
GfxSelectSolidBrush( colorBrightGreen ); // this is the box background color
}
else
{
GfxSelectSolidBrush( colorRed ); // this is the box background color
}
pxHeight = Status( "pxchartheight" ) ;
xx = Status( "pxchartwidth");
Left = 1100;
width = 310;
x = 5;
x2 = 290;
y = pxHeight;
GfxSelectPen( colorGreen, 1); // broader color
GfxRoundRect( x, y - 200, x2, y , 7, 7 ) ;
GfxSetTextColor(colorWhite);
GfxTextOut( ( " VaiSan's Trading System "),55,y-195);
GfxTextOut( (" "),27,y-190);
GfxSetTextColor(colorWhite);
GfxTextOut( ("Last " + sig + " Signal came " + (BarCount-bars-1) * Interval()/60 + " mins ago"), 13, y-170) ; // The text format location
GfxSetTextColor(colorBlack);
GfxTextOut( ("" + WriteIf(sig =="BUY",sig + " @ ",sig + " @") + " : " + entry), 13, y-150);
GfxSetTextColor(colorWhite);
GfxTextOut( ("Trailing SL : " + sl + " (" + WriteVal(IIf(sig == "SELL",entry-sl,sl-entry), 2.2) + ")"), 13, y-130);
GfxSetTextColor(colorYellow);
GfxTextOut( ("TGT:1 : " + tar1), 13, y -110);
GfxTextOut( ("TGT:2 : " + tar2), 13,y-90);
GfxTextOut( ("TGT:3 : " + tar3), 13,y-70);
GfxTextOut( ("TGT:4 : " + tar4), 13,y-50);
GfxSetTextColor(colorDarkGreen);
GfxTextOut( ("Current P/L : " + WriteVal(IIf(sig == "BUY",(C-entry),(entry-C)),2.2)), 65, y-29);;
}
//////////////////////////////////////////////////////////////////////////////////////////////////////////
//////////////////////////////////////////////////////////////////////////////////////////////////////////
if ( sig =="BUY")
{
//GfxSelectSolidBrush( colorBrightGreen ); // this is the box background color
//_SECTION_BEGIN("Magnified Market Price");
FS=Param("Font Size",30,30,100,1);
GfxSelectFont("Arial", FS, 700, italic = False, underline = False, True );
GfxSetBkMode( colorWhite);
GfxSetTextColor( ParamColor("Color",colorGreen) );
Hor=Param("Horizontal Position",750,800,800,800);
Ver=Param("Vertical Position",27,27,27,27);
GfxTextOut(""+C,Hor , Ver );
YC=TimeFrameGetPrice("C",inDaily,-1);
DD=Prec(C-YC,2);
xx=Prec((DD/YC)*100,2);
GfxSelectFont("Arial", 12, 700, italic = False, underline = False, True );
GfxSetBkMode( colorWhite );
GfxSetTextColor(ParamColor("Color",colorGreen) );
GfxTextOut(""+DD+" ("+xx+"%)", Hor+5, Ver+45 );
//_SECTION_END();
}
else
{
//_SECTION_BEGIN("Magnified Market Price");
FS=Param("Font Size",30,30,100,1);
GfxSelectFont("Arial", FS, 700, italic = False, underline = False, True );
GfxSetBkMode( colorWhite);
GfxSetTextColor( ParamColor("Color",colorRed) );
Hor=Param("Horizontal Position",750,800,800,800);
Ver=Param("Vertical Position",27,27,27,27);
GfxTextOut(""+C,Hor , Ver );
YC=TimeFrameGetPrice("C",inDaily,-1);
DD=Prec(C-YC,2);
xx=Prec((DD/YC)*100,2);
GfxSelectFont("Arial", 12, 700, italic = False, underline = False, True );
GfxSetBkMode( colorWhite );
GfxSetTextColor(ParamColor("Color",colorRed) );
GfxTextOut(""+DD+" ("+xx+"%)", Hor+5, Ver+45 );
//_SECTION_END();
}
////////////////////////////////////////////////////////////////////////////////
/*Plot EMA*/
Plot( EMA( Close,13), "13 EMA", colorRed,styleLine);
Plot( EMA( Close,34), "34 EMA", colorBlue,styleLine);
Plot( EMA( Close,55), "55 EMA", colorBlack,styleLine);
Plot( EMA( Close,89), "89 EMA", colorYellow,styleLine);


")