Come into my trading room

#21
Nity again takes support around 4200 level which was the preious low and makes another attempt to continue the intermediate up trend but fails as she faces a lot of reistance every time she gets near 4600.This time nifty makes a lower top at 4550 level.
 

Attachments

#22
Nifty forms a head and shoulders continuation pattern which shows the resumtion of down trend putting an end to the intermediate uptrend.
 

Attachments

Sunil

Well-Known Member
#24
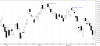
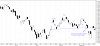
Hi all.I am starting this thread to illustrate in a very simple manner how a beginner trader might have identified the early trend reversal and traded with the trend to make profits. As many beginners feel that bearmarket is difficult to trade i will show the patters from january 2008.I will simply show the chart patterns which have shown reversal of trend.The beginner is expected to have a basic knowledge about double tops and bottoms and head and shoulders mainly to understand my thread.
Raj,

I really enjoyed the recap of 2008.
You have shown how one can still trade with simple chart patterns' knowledge (Chart Analysis) without delving much into Technical Analysis & tools/indicators etc.
Price movement (and thus pattern formation) are the best & most powerful a trader can have in his armory.
If even someone has missed one leg of a move, then instead of trying to jump in midway with stops far away, once can simply wait for pullbacks or a clearer chart pattern to form, and then initiate a position. Thus, proper charts' analysis, besides guiding in trend-determination, also helps in finding entry & stop levels.

I just wanted to add one thing: Textbooks have mentioned about the likely target price, in case of confirmation of a chart pattern breakout.
Like, in case of H&S pattern, the height of the "head" gives the potential target price.
I have seen that in most instances, the said chart patterns of nifty have achieved (and sometimes gone much beyond) the textbook's potential price targets.
Thus, with CA, besides knowing entry & stops, one can have the idea of the potential/likely targets too...

Keep up the impressive & informative work...
:)
 

klo

New Member
#25
One thing i forgot to mention that i also use fibonacci along with chart patterns to trade the nifty.I assume that the previous bull maret that we had untill january 2008 started on 2004, so i draw a fibonacci retracement level connecting the low of 2004 and high of january u can see how beautifully the nifty first took support at the 38.2% level and went back to 23.6% and resumes its downward journey to 50% level then pulls back to the same 38.2% is isn't it amazing?
How are u able to assume that previous bull market started on 2004?
 
#26
How are u able to assume that previous bull market started on 2004?
Dear klo
i am afraid i dont have answer to ur question.I have often heard by the experts in tv that this bull market has started on 2004 and it is 4 years old that is why i assumed 2004 low as the start of bull market.
 
#28
HI friends, i am not able to post charts i think i have used all the space allotted to me to post the charts now what can i do? Do i have to delete my previous charts to post new charts?:confused:
 

Pattel

Well-Known Member
#29
HI friends, i am not able to post charts i think i have used all the space allotted to me to post the charts now what can i do? Do i have to delete my previous charts to post new charts?:confused:
Use any of the image hosting sites and post the forum link. example imageshack.us use the advanced link found all the way to the bottom, by doing this you will not eat up your allocated space for attachments in TJ. You can do them to the charts you posted already. Good luck
 

Similar threads