Daily Analysis By FXGlory

USD/CAD H4 Technical and Fundamental Analysis for 24.07.2024


Time Zone: GMT +3
Time Frame: 4 Hours (H4)


Fundamental Analysis:

The USD/CAD news analysis today is driven by several economic indicators and significant announcements. For the Canadian dollar, the key factors affecting the value of CAD include the Bank of Canada (BoC) Monetary Policy Report, the BoC Rate Statement, and the Overnight Rate decision. These announcements will provide insights into Canada's economic outlook and monetary policy direction, directly affecting the CAD's strength. For the US dollar, critical economic data releases such as the Flash Manufacturing PMI, Flash Services PMI, and New Home Sales numbers are influential. The PMI figures are expected to show slight changes, with Manufacturing PMI forecasted at 51.6 and Services PMI at 55.3. New Home Sales are anticipated to increase from 619K to 639K, indicating growth in the housing sector. These data points will impact USD performance and the overall USD/CAD forecast today.


Price Action:
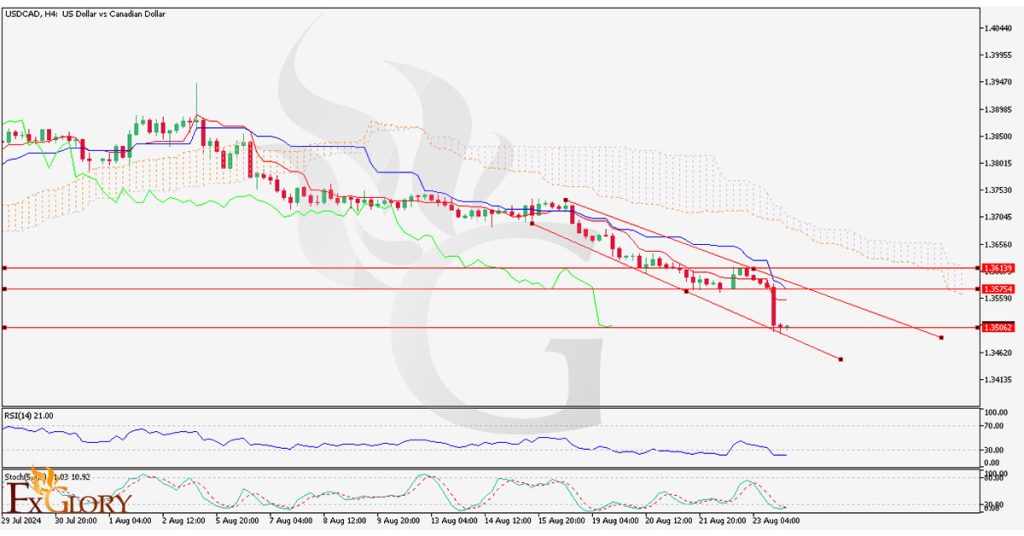
The USD/CAD H4 candlestick chart shows the price climbing within a bullish channel, currently facing resistance at the top of the channel. Despite the price increase, the trade volume on this pair is reducing, signaling a potential end to the bullish phase. The price is also at the top line of the Bollinger Bands, indicating overbought conditions.


Key Technical Indicators:
RSI (Relative Strength Index):
The RSI on USDCAD chart is currently above 70, indicating overbought conditions. This suggests a potential for a price correction or a pause in the bullish momentum.
Bollinger Bands: USDCAD price is touching the upper band, reinforcing the overbought scenario. Traders should watch for a possible price pullback to the middle or lower bands.


Support and Resistance:
Support Levels:
The nearest support level on this pair is at 1.37610, followed by a more substantial support at 1.37300.
Resistance Levels: The immediate resistance level for USDCAD price is at 1.37785, with a significant resistance at 1.37920, which aligns with the top of the bullish channel.


Conclusion and Consideration:
The USD/CAD technical analysis today indicates a strong bullish trend on the H4 chart, but with signs of overbought conditions as highlighted by the RSI and Bollinger Bands. The reducing trade volume further suggests a possible end to the bullish phase. Given the upcoming economic data releases and the BoC's announcements, traders should remain cautious. The BoC Monetary Policy Report and Rate Statement, along with USD economic indicators like the Flash PMIs and New Home Sales, will provide critical insights for trading strategies. Employ proper risk management and stay alert to news updates for informed trading decisions.


Disclaimer: The provided analysis is for informational purposes only and does not constitute investment advice. Traders should conduct their own research and analysis before making any trading decisions.


FXGlory
24.07.2024
 
EURUSD H4 Technical and Fundamental Analysis for 25.07.2024


Time Zone: GMT +3
Time Frame: 4 Hours (H4)


Fundamental Analysis:
The EUR/USD forecast today is currently influenced by a series of upcoming economic events and data releases. For the USD, key events include speeches from FOMC members Bowman and Logan, as well as President Biden's announcement. High-impact data such as the Advance GDP q/q, Unemployment Claims, and Durable Goods Orders will also play crucial roles. These events are likely to provide significant volatility in the market. In the Eurozone, the Ifo Business Climate Index and ECB-related announcements will shape market sentiment. Strong US economic data and hawkish tones from FOMC members may strengthen the USD, potentially pushing the EUR/USD pair, also known as the Fiber, lower.


Price Action:
The EUR/USD H4 chart has recently broken below the Ichimoku cloud, indicating a shift to a bearish trend. The pair is experiencing a downward movement, forming lower highs and lower lows, typical of a bearish trend. The pair’s price action suggests continued downward pressure, with the price finding resistance at the lower boundary of the Ichimoku cloud.


Key Technical Indicators:
Ichimoku Cloud:
The price breaking below the Ichimoku cloud is a bearish signal. The future cloud is bearish as well, with Span A below Span B, indicating potential continued downward momentum.
RSI (Relative Strength Index): The RSI is around 35.39, which is close to the oversold territory. This indicates that while the bearish momentum is strong, there may be limited room for further immediate decline before a potential correction.
MACD (Moving Average Convergence Divergence): The MACD indicator shows a negative histogram with the MACD line below the signal line, reinforcing the bearish sentiment. This suggests that downward momentum is currently prevailing.


Support and Resistance:
Support Levels:
Immediate support is found at 1.08345, with stronger support at 1.08000.
Resistance Levels: Immediate resistance is at 1.08574, followed by 1.08870 and 1.09039. A break above these levels would be required to negate the current bearish trend.


Conclusion and Consideration:
The EUR/USD technical analysis on the H4 chart is exhibiting bearish tendencies, confirmed by the price breaking below the Ichimoku cloud and negative signals from the MACD. The RSI suggests the pair is nearing oversold conditions, which could lead to a short-term corrective bounce. However, the overall sentiment remains bearish unless significant resistance levels are breached. As for the Fiber’s fundamental analysis today, traders should closely monitor the upcoming economic data releases and FOMC speeches for further direction. Proper risk management, such as setting stop losses, is crucial in this volatile environment.


Disclaimer: The provided analysis is for informational purposes only and does not constitute investment advice. Traders should conduct their own research and analysis before making any trading decisions.


FXGlory
25.07.2024
 
GOLD H4 Daily Technical and Fundamental Analysis for 26.07.2024


Time Zone: GMT +3
Time Frame: 4 Hours (H4)


Fundamental Analysis
The GOLD market (GOLD/USD, XAU/USD) is closely watched by traders due to its safe-haven status and sensitivity to economic data. Today, several key economic indicators from the U.S. are expected to impact the gold market. The Core PCE Price Index m/m, forecasted at 0.2%, is crucial as it influences inflation expectations and the Federal Reserve's monetary policy. Lower-than-expected data could weaken the USD, potentially boosting gold prices. Additionally, Personal Income and Personal Spending data will provide insights into consumer health and economic activity. Revised University of Michigan Consumer Sentiment and Inflation Expectations also play significant roles, reflecting consumer confidence and future inflation outlook. The ongoing G20 meetings may introduce additional volatility as global economic policies and issues are discussed, affecting currency and commodity markets, including gold.


Price Action
Analyzing the H4 chart for GOLD/USD, we observe a strong bearish trend with the price moving within a descending channel. The recent candles show a clear downward movement, reflecting selling pressure. Despite a few attempts at bullish corrections, the overall momentum remains bearish. The GOLD price is currently trading below the Ichimoku Cloud, indicating continued bearish sentiment. The recent interaction with the Fibonacci retracement levels suggests minor support, but the price has largely respected the bearish trend.


Key Technical Indicators
Ichimoku Cloud:
The current XAUUSD price is below the Ichimoku Cloud, indicating a bearish outlook. The cloud itself is bearish, further supporting the downtrend. This suggests that selling pressure remains strong, and the bearish trend is likely to continue.
RSI (14): The RSI is currently at 31.81, indicating that the market is approaching oversold conditions. While this might suggest a potential for a short-term bounce, the overall bearish momentum could persist until a significant reversal signal is observed.
Volumes: The trading volume shows a gradual increase in selling activity, supporting the bearish trend. Higher volumes on down moves suggest strong participation from sellers, reinforcing the bearish outlook.
Parabolic SAR (0.2): The Parabolic SAR dots are positioned above the candles, indicating a bearish signal. This trend-following indicator confirms the current downtrend, suggesting that the selling pressure is likely to continue.


Support and Resistance
Support Levels:
Immediate support is at the 23.6% Fibonacci retracement level around 2366.91, followed by further support at 2330.96.
Resistance Levels: Immediate resistance is at the 38.2% Fibonacci retracement level around 2389.16, with further resistance at the 50% level near 2403.71.


Conclusion and Consideration
The GOLD/USD pair on the H4 chart indicates a strong bearish trend, supported by technical indicators like the Ichimoku Cloud, RSI, Fibonacci retracement levels, and Parabolic SAR. The current price action suggests continued downward pressure, though oversold RSI levels may hint at a potential short-term bounce. Fundamental factors, including today's key U.S. economic data and ongoing G20 meetings, could introduce volatility. Traders should remain cautious and watch for any significant news that might impact market sentiment.


Disclaimer: The GOLD analysis provided is for informational purposes only and does not constitute investment advice. Traders should conduct their own research and analysis before making any trading decisions. Market conditions can change rapidly, and it is essential to stay updated with the latest information.


FXGlory
26.07.2024
 
GBP/CAD H4 Technical and Fundamental Analysis for 16.08.2024


Time Zone: GMT +3
Time Frame: 4 Hours (H4)


Fundamental Analysis:
The GBPCAD currency pair represents the exchange rate between the British Pound (GBP) and the Canadian Dollar (CAD). Today, the GBP might experience fluctuations due to upcoming economic data releases, such as the UK's retail sales figures, which can provide insight into consumer spending and economic health. Meanwhile, the CAD is likely to be influenced by the release of Canadian inflation data, which will be closely monitored for any indications of future monetary policy adjustments by the Bank of Canada. Additionally, oil prices, a critical factor for the CAD, remain volatile, potentially affecting the CAD's strength against the GBP.


Price Action:
In the H4 timeframe, the GBP/CAD has exhibited a bullish trend over the past week. The price has been moving within an ascending channel, as indicated by the clear higher highs and higher lows formation. The last three candles have been bullish, with the most recent candle closing near a key resistance level, suggesting strong buying momentum. However, the price is nearing the upper boundary of the ascending channel, which may act as a resistance zone, potentially leading to a consolidation phase or a minor pullback.


Key Technical Indicators:
Parabolic SAR (0.2):
The Parabolic SAR indicator shows a bullish trend, with the last three dots placed below the candlesticks. This positioning of the Parabolic SAR below the price indicates continued upward momentum. The recent bullish candles reinforce the likelihood of further gains in the short term unless a reversal signal emerges.
Alligator Indicator: The Alligator indicator is currently bullish, with the green lips line (fastest moving average) crossing above the red teeth line (medium moving average) and the red teeth line positioned above the blue jaws line (slowest moving average). This alignment of the Alligator's lines indicates that the upward trend is strengthening, with the GBPCAD price likely to continue its bullish movement in the near term.
MACD (Moving Average Convergence Divergence): The MACD is in bullish territory, with the MACD line above the signal line. The histogram bars are positive, indicating that the bullish momentum is gaining strength. The widening gap between the MACD and the signal line suggests an acceleration in the upward trend, although traders should watch for any signs of divergence that could indicate a potential trend reversal.
%R (14): The Williams %R is currently around -8.62, indicating that the GBP CAD pair is in overbought territory. While this suggests that the bullish trend is strong, it also signals a potential for a short-term correction as the market may be overstretched. Traders should be cautious of a possible pullback or consolidation in the coming sessions.


Support and Resistance:
Support:
Immediate support is located at 1.75615, which aligns with the 38.2% Fibonacci retracement level and the lower boundary of the ascending channel. This level has acted as a strong support in the past and could provide a base for further upward movement if the price tests this area.
Resistance: The nearest resistance level is at 1.76740, which corresponds to the 61.8% Fibonacci retracement level and the upper boundary of the ascending channel. A break above this level could open the door for further gains, potentially targeting the next resistance around 1.77500.


Conclusion and Consideration:
The GBP/CAD forex pair on the H4 chart shows strong bullish momentum supported by the Parabolic SAR, Alligator, MACD, and %R indicators. The current price action within the ascending channel indicates that the bulls remain in control. However, with the %R in overbought territory, there could be a risk of a short-term pullback or consolidation. Traders should be cautious around the 61.8% Fibonacci resistance level and consider any potential retracements as opportunities to re-enter the bullish trend.


Disclaimer: This GBPCAD technical and fundamental analysis is intended for informational purposes only and does not constitute investment advice. Market conditions can change rapidly, and it is essential to conduct your own analysis and stay updated with the latest information before making any trading decisions.


FXGlory
16.08.2024
 
CADJPY H4 Technical and Fundamental Analysis for 19.08.2024


CADJPY_H4_Chart_Daily_Technical_and_Fundamental_Analysis_for_08.jpg


Time Zone: GMT +3
Time Frame: 4 Hours (H4)


Fundamental Analysis:

The CAD/JPY fundamental analysis today is influenced by various macroeconomic factors and market sentiment. The Canadian Dollar is often correlated with oil prices, as Canada is a major oil exporter. Rising oil prices typically strengthen the CAD. Meanwhile, the Japanese Yen, often seen as a safe-haven currency, is influenced by global risk sentiment and Japan’s economic indicators, such as machine orders and monetary policy. The upcoming release of Japan's machine orders data is crucial as it may affect the JPY by indicating the health of Japan’s manufacturing sector. A stronger-than-expected release could lead to a stronger Yen, putting pressure on the CAD/JPY forecast.


Price Action:
The CAD/JPY H4 chart shows that the pair has been in a consolidation phase after a previous downtrend. The price is currently moving within a channel, bounded by rising trendlines, suggesting a gradual upward movement. However, recent candles indicate a struggle to break above the immediate resistance, highlighting potential indecision in the market. The pair’s price action shows it has recently tested and held above a key support level, which could suggest a buildup for another upward push if it holds.


Key Technical Indicators:

Ichimoku Cloud:
The price is trading near the upper boundary of the Ichimoku Cloud, which acts as resistance. A break above this level could signal a potential bullish breakout, while failure to do so might lead to a retracement.
RSI (Relative Strength Index):
The RSI is currently at 55.90, indicating that the pair is in neutral to slightly bullish territory. There’s still room for upward movement before the market reaches overbought conditions.
MACD (Moving Average Convergence Divergence):
The MACD line is slightly above the signal line, and the histogram is in positive territory, suggesting that the bullish momentum is still intact but not overwhelmingly strong.


Support and Resistance:

Support Levels:
The key support levels are at 107.495 and 107.010, with the latter being crucial as it aligns with the lower trendline of the channel.
Resistance Levels:
Immediate resistance is found at 108.052, followed by a stronger resistance at 108.749. A break above these levels could lead to further gains toward 109.500.


Conclusion and Consideration:
The CAD/JPY technical analysis today on the pair’s H4 chart depicts a consolidation phase with the potential for an upward breakout if it can sustain above the current resistance levels. Traders should monitor the RSI for signs of overbought conditions and the MACD for any changes in momentum. Given the upcoming machine orders data from Japan, there may be increased volatility in the pair. Conservative traders might wait for a clear breakout from the current range before entering new positions. It’s also advisable to implement risk management strategies, such as stop-loss orders, especially given the pair's proximity to key resistance levels.


Disclaimer: The provided analysis is for informational purposes only and does not constitute investment advice. Traders should conduct their own research and analysis before making any trading decisions.


FXGlory
19.08.2024
 
EURUSD H4 Technical and Fundamental Analysis for 21.08.2024


EURUSDmH4.jpg


Time Zone: GMT +3
Time Frame: 4 Hours (H4)


Fundamental Analysis:
The EUR/USD pair, reflecting the exchange rate between the Euro and the US Dollar, is currently influenced by recent economic data releases from both the Eurozone and the United States. In the Eurozone, the latest PMI readings suggest a mixed economic outlook. The French Manufacturing PMI slightly improved to 44.4 from 44.0, indicating a marginal recovery, although the sector remains in contraction. The French Services PMI edged up to 50.2 from 50.1, pointing to stability in the services sector. Similarly, Germany’s Manufacturing PMI, while still weak at 43.4, showed a minor improvement from 43.2, whereas the Services PMI dipped slightly to 52.3 from 52.5, reflecting a slight slowdown. Meanwhile, in the United States, a significant drawdown in Crude Oil Inventories by -2.0M barrels, against expectations of a 1.4M increase, could signal potential supply constraints, influencing inflation expectations. Additionally, the upcoming FOMC Meeting Minutes will be crucial, as they are likely to offer insights into the Federal Reserve’s stance on future interest rates, a key driver of the USD's strength or weakness. These mixed economic signals suggest a cautious outlook for the EUR/USD pair, with the potential for heightened volatility depending on further developments in economic data and central bank policies.


Price Action:
On the H4 timeframe, the EUR/USD pair has experienced a robust bullish wave, propelling the price towards a significant resistance level. The recent price action has shown the formation of candlestick patterns at this resistance, indicating that the bullish momentum may be losing strength. This setup raises the possibility of a bearish correction, particularly as the price approaches this critical resistance. The technical indicators also reinforce this outlook. The MACD indicator is displaying signs of negative divergence, with the MACD line remaining below the signal line despite recent price highs, suggesting that the bullish momentum could be weakening. Similarly, the Williams %R is signaling overbought conditions, hovering near the -10 level, which typically precedes a market pullback.


Key Technical Indicators:

MACD (Moving average Convergence Divergence): The MACD indicator is showing signs of a negative divergence, where the MACD line remains below the signal line despite the recent price highs. This divergence could indicate weakening bullish momentum and the potential for a bearish correction.
Williams %R (Percent Range): The Williams %R is also indicating overbought conditions, hovering near the -10 level, suggesting that the market might be due for a pullback.

Support and Resistance:

Support: Potential support levels to watch for a bearish correction include the 61.8% Fibonacci retracement at 1.0975, the 50% retracement at 1.0901, and the 38.2% retracement at 1.0831.
Resistance: The nearest resistance is at 1.1187, which corresponds with the current high and the 100% Fibonacci extension level.


Conclusion and Consideration:
The EUR/USD pair on the H4 chart is at a critical juncture, with potential for a bearish correction after a significant bullish wave. The negative divergence in the MACD and the overbought signal from the Williams %R suggest that a pullback could be imminent. Traders should consider short positions if the price action confirms a reversal at the current resistance level, targeting the key Fibonacci retracement levels as potential profit zones.

Disclaimer: The EURUSD provided analysis is for informational purposes only and does not constitute investment advice. Traders should conduct their own research and analysis before making any trading decisions. Market conditions can change rapidly, and it is essential to stay updated with the latest information. Always consider risk management strategies and consult with a financial advisor if necessary.


FXGlory
21.08.2024
 
USDCAD H4 Technical and Fundamental Analysis for 08.26.2024


Time Zone: GMT +3
Time Frame: 4 Hours (H4)


Fundamental Analysis:
The USD/CAD news analysis today is influenced by a variety of macroeconomic factors, including crude oil prices (since Canada is a major oil exporter), interest rate differentials between the Federal Reserve and the Bank of Canada, and economic indicators such as GDP growth, employment data, and inflation rates. Additionally, recent data releases related to U.S. durable goods orders are crucial as they indicate future production levels and economic strength. An actual reading higher than forecasted is generally seen as positive for the U.S. dollar. As a leading indicator of economic activity, a robust increase in these orders can signal that manufacturers anticipate stronger demand, which could support the USD against other currencies, including the CAD, subsequently affecting the pair also known as the “Loonie.”


Price Action:
The USD/CAD H4 chart shows the pair’s bearish trend, characterized by a series of lower highs and lower lows. The Loonie’s price action has seen a downward momentum, breaking below key support levels, and trending within a downward-sloping channel. The pair’s candlestick patterns indicate selling pressure, with a lack of significant bullish reversal signs at the moment. A breakdown below the current support zone could lead to further declines, confirming the continuation of the bearish trend.


Key Technical Indicators:
Ichimoku Cloud:
The price is trading below the Ichimoku cloud, indicating the pair’s bearish market sentiment. The cloud itself is acting as a resistance, and the lagging span (Chikou Span) confirms this bearish outlook as it is also below the price action. The future cloud is thin and bearish, suggesting that there is no immediate sign of reversal in this downtrend.
RSI (Relative Strength Index): The RSI is currently at 21, indicating that the market is in oversold territory. This suggests that while the bearish momentum is strong, there might be a potential for a short-term corrective bounce. However, oversold conditions alone do not indicate a reversal but rather that the current trend might be overstretched.
Stochastic Oscillator: The Stochastic indicator is also in the oversold region (around 10.92), which aligns with the RSI reading, indicating that the selling pressure might be nearing exhaustion. The possibility of a bullish crossover in the stochastic lines may hint at a potential short-term recovery, but confirmation is needed.


Support and Resistance:
Support Levels:
Immediate support is seen at the 1.35062 level, which aligns with the lower boundary of the current descending channel. A break below this level could open the way towards further downside targets around 1.3450.

Resistance Levels: The nearest resistance level is marked at 1.35574, followed by a more significant resistance at 1.36139, which corresponds to the upper boundary of the descending channel and the Ichimoku cloud’s lower edge.


Conclusion and Consideration:
The USD/CAD technical analysis today on the H4 timeframe is exhibiting its strong bearish sentiment, as evidenced by the technical indicators and the descending price channel. While oversold conditions on the RSI and Stochastic indicators suggest a possible short-term correction, the prevailing trend remains bearish. Traders should watch for the price action around the key support and resistance levels for potential breakout or reversal signals. The Loonie’s Fundamental analysis data, such as the upcoming durable goods orders release, could provide additional volatility and direction for the USD/CAD forecast. Risk management strategies, including the use of stop-loss orders, are advisable given the current market conditions.


Disclaimer: The provided analysis is for informational purposes only and does not constitute investment advice. Traders should conduct their own research and analysis before making any trading decisions.


FXGlory
08.26.2024
 
USD/JPY H4 Technical and Fundamental Analysis for 08.27.2024


Time Zone: GMT +3
Time Frame: 4 Hours (H4)


Fundamental Analysis:
The upcoming economic data releases from both the US and Japan are set to influence the USD/JPY pair's direction prediction. In the US, key indicators such as the S&P/CS Composite-20 HPI y/y, HPI m/m, CB Consumer Confidence, and Richmond Manufacturing Index will be released. The S&P/CS Composite-20 HPI y/y is expected to show a slight decrease from 6.8% to 6.2%, indicating a cooling in the housing market. Meanwhile, the CB Consumer Confidence index is expected to rise to 100.9 from a previous 100.3, suggesting improved consumer sentiment. The Richmond Manufacturing Index is projected to show an improvement from -17 to -14, which still indicates contraction but at a slower pace. These mixed data points could create a volatile trading environment for the USD.
On the Japanese side, the Services Producer Price Index (SPPI) y/y is forecasted to slightly decrease from 3.0% to 2.9%, signaling a potential slowdown in price pressures; which stands as an important forecast element for this fore pair. The BOJ Core CPI y/y is expected to remain stable at 2.1%, suggesting persistent inflation concerns within Japan. The stable inflation rate and the recent dovish stance of the Bank of Japan could continue to exert downward pressure on the JPY.


Price Action:
The USD/JPY pair is forming a bearish flag pattern on the H4 chart after a significant bearish wave, which suggests a potential continuation of the downward trend. The price is currently consolidating within this pattern, and a breakout to the downside could accelerate the bearish momentum. However, the presence of bullish technical indicators points to a possible short-term corrective wave.


Key Technical Indicators:
RSI (Relative Strength Index):
The RSI is currently at 41.70, indicating bearish sentiment, yet it is not in the oversold territory, suggesting room for further downside before a reversal might occur.

MACD (Moving Average Convergence Divergence): The Stochastic is approaching the 70 level, indicating potential for a bullish wave in the short term if it crosses above this threshold. This could signal a temporary upward correction within the broader bearish trend.


Support and Resistance:
Support Levels:
The nearest support is at the lower trendline of the bearish flag pattern, around 144.00. A break below this level could see the pair testing the next support near 142.50, which aligns with previous lows.
Resistance Levels: Immediate resistance is at the upper trendline of the bearish flag, around 145.00. A break above this level could target the next resistance at 146.50, potentially invalidating the bearish flag pattern and signaling a bullish reversal.


Conclusion and Consideration:
The USD/JPY H4 chart suggests that the pair is consolidating within a bearish flag pattern, with potential for further downside if key support levels are breached. Traders should closely monitor the upcoming economic data releases from both the US and Japan, as these could provide the catalyst for the next major move. Given the mixed signals from technical indicators and fundamental outlook, traders should be prepared for both bearish and short-term bullish scenarios, adapting their strategies accordingly to the evolving market conditions.


Disclaimer: The provided analysis is for informational purposes only and does not constitute investment advice. Traders should conduct their own research and analysis before making any trading decisions.


FXGlory
08.27.2024
 
EURUSD H4 Technical and Fundamental Analysis for 28.08.2024


EURUSDH4.jpg


Time Zone: GMT +3
Time Frame: 4 Hours (H4)


Fundamental Analysis:
The EUR/USD pair, reflecting the exchange rate between the Euro and the US Dollar, is currently navigating through various economic data releases from both the Eurozone and the United States. In the Eurozone, inflation data has presented a mixed picture. Germany's Preliminary Consumer Price Index (CPI) came in flat at 0.0% for the month, below expectations of a 0.3% increase, suggesting subdued inflationary pressures in Europe's largest economy. Meanwhile, Spain's Flash CPI showed a year-on-year increase of 2.4%, which is below the anticipated 2.8%, indicating lower inflationary momentum than expected. These figures suggest that inflation concerns might be less pronounced in the Eurozone, possibly leading to a more dovish stance from the European Central Bank.

On the US side, economic indicators such as the Preliminary Gross Domestic Product (GDP) q/q showed a stable 2.8% growth rate, aligning with market expectations. This stability is indicative of a resilient economic outlook in the US. Additionally, the Unemployment Claims remained consistent at 232K, further reinforcing a stable labor market. The Preliminary GDP Price Index, also stable at 2.3%, aligns with market forecasts, indicating controlled inflation in the US. These stable economic indicators in the US might support the Federal Reserve's current monetary policy stance, impacting the USD's strength relative to the Euro.


Price Action:
On the H4 timeframe, the EUR/USD pair has experienced a notable bullish wave, driving the price higher towards key resistance levels. Recent price action suggests that this bullish momentum may be waning, as indicated by candlestick patterns that show indecision or possible reversal near these resistance levels. A bearish correction could be on the horizon, particularly if the bullish momentum fails to break through the established resistance.


Key Technical Indicators:

Ichimoku Cloud: The Ichimoku Cloud analysis shows that Tenkan-sen (blue line) is about to cross below Kijun-sen (red line), a bearish signal suggesting potential trend reversal. The price has been trading above the cloud, indicating an uptrend, but the potential Tenkan-Kijun crossover is a warning of a shift in momentum.
Relative Strength Index (RSI): The RSI is showing a negative divergence, where the price makes higher highs, but the RSI fails to confirm those highs, indicating weakening bullish momentum. Currently, RSI is at 55.8787, which is in the neutral zone but leaning towards overbought conditions.
Volume Analysis: The volume has not significantly supported the recent bullish wave, implying that the upward momentum might lack the strength to sustain a further rally. Lower volume during price increases often indicates potential exhaustion of buying interest.


Support and Resistance:
Support:
The nearest resistance level is at 1.1187, which is a recent high and could serve as a barrier for further upward movement. A break above this level could signal the continuation of the bullish trend.
Resistance: Key support levels to monitor include 1.1100, near the base of the Ichimoku cloud, and further below at 1.0975, where a significant Fibonacci retracement level lies.


Conclusion and Consideration:
The EUR/USD pair on the H4 chart is showing signs of a potential bearish correction following a strong bullish wave. Negative divergence in the RSI, a potential bearish Tenkan-sen and Kijun-sen crossover in the Ichimoku Cloud, and low volume support suggest that the bullish momentum may be fading. Traders should look for confirmation of a reversal through price action around the current resistance level before considering short positions. Profit-taking could be aimed at key support levels like 1.1100 and 1.0975, using tight stop-losses to manage risk effectively.

Disclaimer: The EUR/USD analysis provided is for informational purposes only and does not constitute investment advice. Traders should conduct their own research and analysis before making any trading decisions. Market conditions can change rapidly, and it is essential to stay updated with the latest information. Always consider risk management strategies and consult with a financial advisor if necessary.

FXGlory
28.08.2024
 
EUR/CAD H4 Technical and Fundamental Analysis for 08.30.2024


Time Zone: GMT +3
Time Frame: 4 Hours (H4)


Fundamental Analysis:

The upcoming economic data releases from both the US and Japan are set to influence the USD/JPY pair's direction prediction. In the US, key indicators such as the S&P/CS Composite-20 HPI y/y, HPI m/m, CB Consumer Confidence, and Richmond Manufacturing Index will be released. The S&P/CS Composite-20 HPI y/y is expected to show a slight decrease from 6.8% to 6.2%, indicating a cooling in the housing market. Meanwhile, the CB Consumer Confidence index is expected to rise to 100.9 from a previous 100.3, suggesting improved consumer sentiment. The Richmond Manufacturing Index is projected to show an improvement from -17 to -14, which still indicates contraction but at a slower pace. These mixed data points could create a volatile trading environment for the USD.
On the Japanese side, the Services Producer Price Index (SPPI) y/y is forecasted to slightly decrease from 3.0% to 2.9%, signaling a potential slowdown in price pressures; which stands as an important forecast element for this fore pair. The BOJ Core CPI y/y is expected to remain stable at 2.1%, suggesting persistent inflation concerns within Japan. The stable inflation rate and the recent dovish stance of the Bank of Japan could continue to exert downward pressure on the JPY.

Price Action:
The USD/JPY pair is forming a bearish flag pattern on the H4 chart after a significant bearish wave, which suggests a potential continuation of the downward trend. The price is currently consolidating within this pattern, and a breakout to the downside could accelerate the bearish momentum. However, the presence of bullish technical indicators points to a possible short-term corrective wave.


Key Technical Indicators:
Support Levels:
The immediate support is at 1.4881. A break below this level could see the pair testing lower support zones, which may align with historical lows.
Resistance Levels: The immediate resistance is the descending trend line. A successful breakout above this line, confirmed with a close above 1.4932, could indicate a shift to a bullish phase, targeting higher resistance areas.

Support and Resistance:
Support Levels:
The nearest support is at the lower trendline of the bearish flag pattern, around 144.00. A break below this level could see the pair testing the next support near 142.50, which aligns with previous lows.
Resistance Levels: Immediate resistance is at the upper trendline of the bearish flag, around 145.00. A break above this level could target the next resistance at 146.50, potentially invalidating the bearish flag pattern and signaling a bullish reversal.

Conclusion and Consideration:
The EUR/CAD H4 chart suggests that while the pair is in a bearish trend, technical indicators are showing signs of a potential short-term reversal due to bullish divergence and oversold conditions. Fundamental factors, including weaker-than-expected Eurozone inflation data and slightly weaker Canadian GDP figures, could provide mixed influences on the pair. Traders should closely monitor the price action around the descending trend line for potential breakout opportunities, either to the upside for a buy signal or to the downside below the support level for a sell signal.

Disclaimer: The provided analysis is for informational purposes only and does not constitute investment advice. Traders should conduct their own research and analysis before making any trading decisions.

FXGlory
08.30.2024
 

Similar threads