USD/CAD Current Market Overview
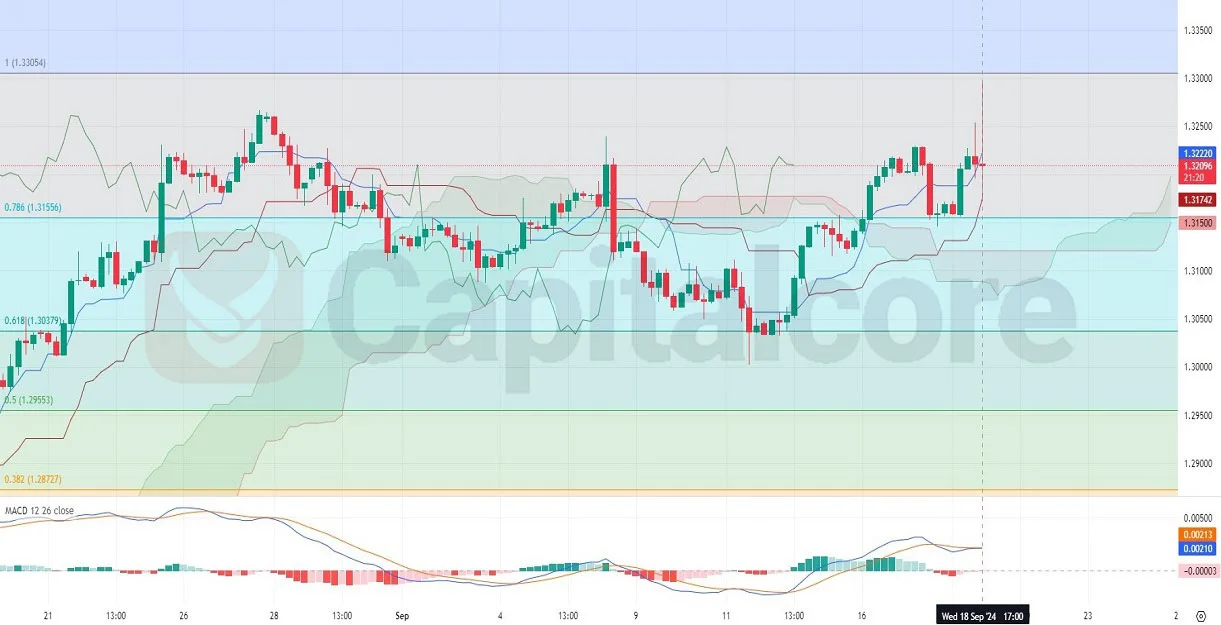
USD/CAD, also known as the “Loonie,” reflects the exchange rate between the U.S. dollar and the Canadian dollar. The pair has recently shown signs of bullish momentum, but this trend is beginning to lose steam, as evidenced in the latest price action. The chart displays a gradually weakening upward slope, suggesting that buyers might be losing control. Today, both the U.S. and Canadian economies are expected to release significant data, including U.S. housing starts and the Federal Reserve’s statement on interest rates, which could cause volatility. Additionally, the Bank of Canada (BoC) is expected to release the Summary of Deliberations, adding more potential for movement in the pair.

Chart Notes:
• Chart time-zone is UTC (+03:00)
• Candles’ time-frame is 4h.
Technically, the Relative Strength Index (RSI) has broken out of its bullish structure, indicating a possible shift toward bearish sentiment. Meanwhile, the Moving Average Convergence Divergence (MACD) is showing signs of a bearish wave potentially forming, with the MACD line approaching the signal line from above. Given the fundamental backdrop, including crude oil inventory reports, interest rate decisions, and projections, these indicators suggest caution for traders as a potential downturn may follow in the coming sessions.
• DISCLAIMER: Please note that the above analysis is not an investment suggestion by “Capitalcore Ltd”. This post has been published only for educational purposes.
Capitalcore
USD/CAD, also known as the “Loonie,” reflects the exchange rate between the U.S. dollar and the Canadian dollar. The pair has recently shown signs of bullish momentum, but this trend is beginning to lose steam, as evidenced in the latest price action. The chart displays a gradually weakening upward slope, suggesting that buyers might be losing control. Today, both the U.S. and Canadian economies are expected to release significant data, including U.S. housing starts and the Federal Reserve’s statement on interest rates, which could cause volatility. Additionally, the Bank of Canada (BoC) is expected to release the Summary of Deliberations, adding more potential for movement in the pair.
Chart Notes:
• Chart time-zone is UTC (+03:00)
• Candles’ time-frame is 4h.
Technically, the Relative Strength Index (RSI) has broken out of its bullish structure, indicating a possible shift toward bearish sentiment. Meanwhile, the Moving Average Convergence Divergence (MACD) is showing signs of a bearish wave potentially forming, with the MACD line approaching the signal line from above. Given the fundamental backdrop, including crude oil inventory reports, interest rate decisions, and projections, these indicators suggest caution for traders as a potential downturn may follow in the coming sessions.
• DISCLAIMER: Please note that the above analysis is not an investment suggestion by “Capitalcore Ltd”. This post has been published only for educational purposes.
Capitalcore