http://www.traderji.com/attachments...eeded-elecastwave-eek-please-dnt-kill-me-.png
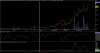
This is the chart!
I am just plotting the trendiness between points! From my observation, it helps me to identify strong support and resistance levels. The waves also help me to know the momentum of a tide!
I am using some thermodynamics idea in plotting the wave(PV=RT)
Also included position recognition based on velocity(/momentum/rate of change)
Just one liners with 3-4 math operators! Plotting this is easy.
Some experts here feel the waves are similar to PFB or CFB.I am unable to get info of PFB and CFB.
I also look for same slope of rise, same price area, same patterns, cyclic nature etc.


