Nice going, Saif.
Just in my usage of my personal methodology, and using this chart as the only thing to decide an entry, I also could not get a better signal to go short.
In not knowing anything about this market, I would say it is headed back to the recent leveling of the tenken, and possibly the kijun.
As a cursory glance at the chart, I would also guess my WR2 is in that area.
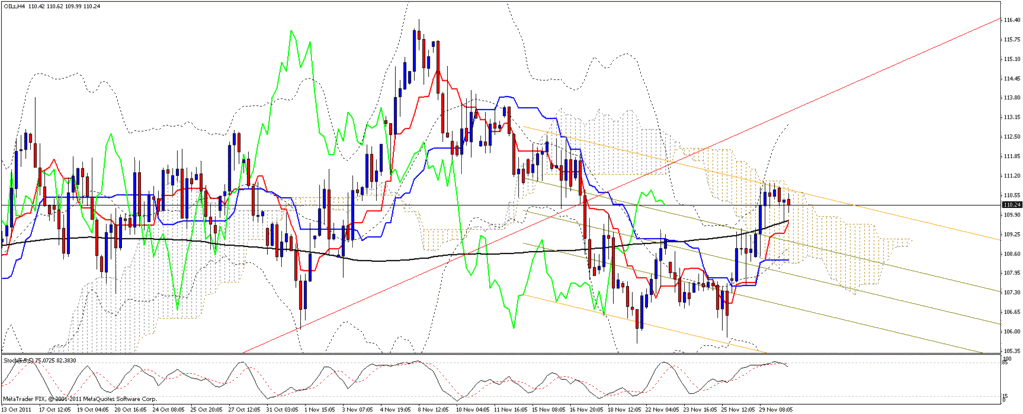
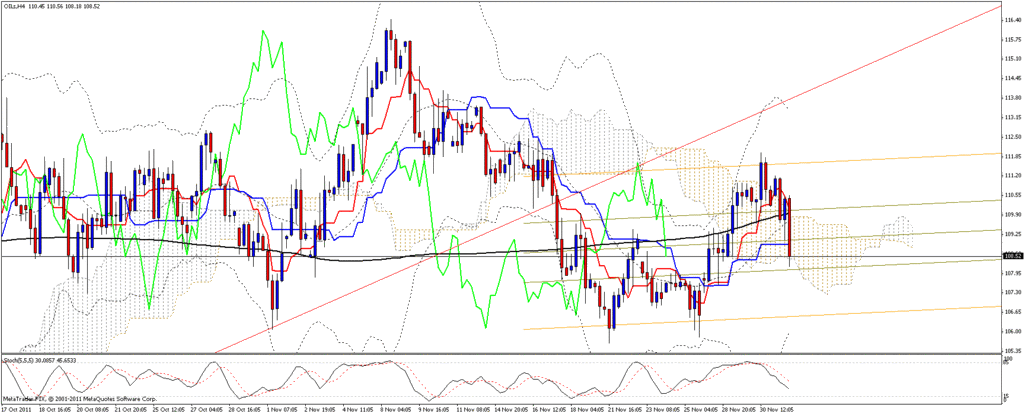
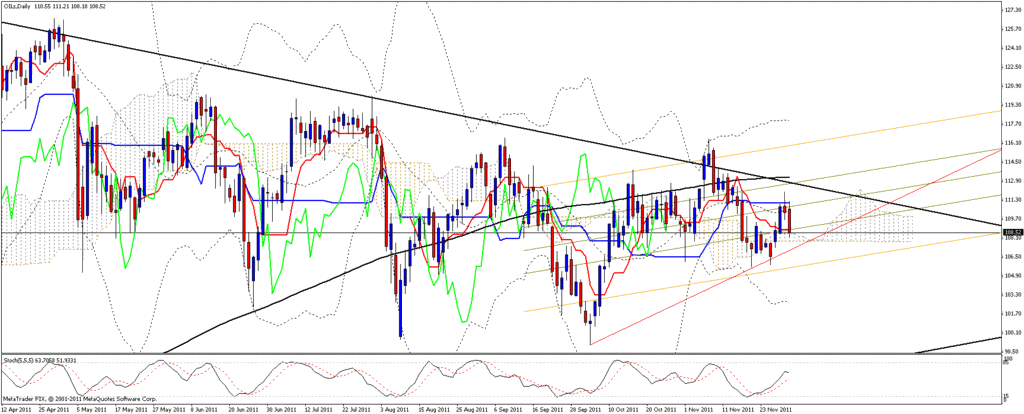
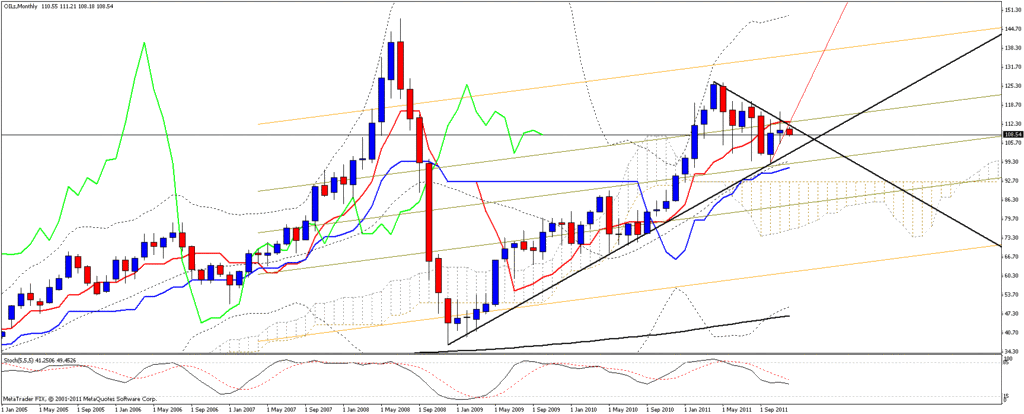
Sir just curious to show you - as an example this is ICE crude oil future. this is the h4 I entered long on the h4 below the cloud with respect to the daily chart at 108.20 just after the momentum shifted north I wanted to see if I could ride all the way to the previous cloud Span -B at 111.23 ! I exited this trade at 110.34 ! as the chart shows the Span-A acting as a Strong R, price on the SD extreme giving a warning signature for a reversal to the down! Bollinger bands highly volatile touching the top band! stoch highly overbought and now pointing the momentum south !! I cannot get any better signal to exit this trade on my long ")