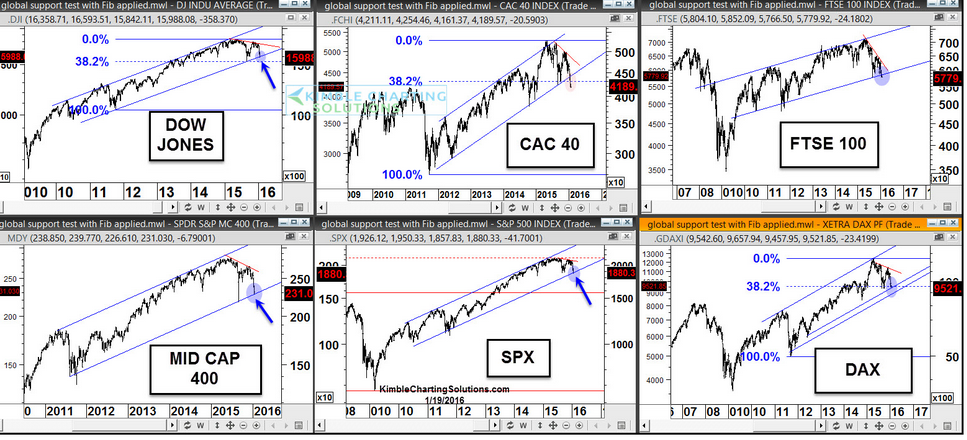
I have been trading NF looking at S&P Futures from 9:15 AM - 1:30 PM, and FTSE spot from 1:30 PM - 3:00 PM. I am almost sure now that NF just follows them, S/R and price action is much sacrosanct in these markets as compared to NF, for the simple reason being the amount of money flowing into these respective markets. NF is way more volatile than those.
This experiment seems to be working since Monday. My hit rate used to be low trading with just NF chart, but it has considerably improved. I had just one losing trade on Tue (due to very tight SL which got hit, otherwise movement was as expected after just one bar), 2 losing trade Wed (both speculative and taken out of system) and 0 losing trade today till now (3 shorts, including one at 7400, taken as per S&P futures chart, all 3 worked). SLs are placed generally wide because NF swings 30 odd points for every 5 point swing in S&P, before resuming what S&P chart says. Although data is too low to make a judgement, but I like where this experiment is going. :thumb:
PS: This is of course in absence of any major India centric event, like monetary policy, fiscal policy or results of major corporations.
 .
.


