


My afl collection
- Thread starter shivangi77
- Start date
- Status
- Not open for further replies.


Can some one help in making a crossover AFL....
EMA=13,34,55
Buy condition when 13 ema will be on top, 34 ema will be in middle and 55 ema will be on bottom then only a buy signal will generate.
Sell condition when 13 ema will be on bottom 34 ema will be in middle and 55 ema on top then only a sell signal will generate.
SL of buying will be when 13 ema crosses the 34 ema from top and SL for selling will be when 13 ema crosses the 34 ema from bottom.
Regards
Regards:clapping:
Can some one help in making a crossover AFL....
EMA=13,34,55
Buy condition when 13 ema will be on top, 34 ema will be in middle and 55 ema will be on bottom then only a buy signal will generate.
Sell condition when 13 ema will be on bottom 34 ema will be in middle and 55 ema on top then only a sell signal will generate.
SL of buying will be when 13 ema crosses the 34 ema from top and SL for selling will be when 13 ema crosses the 34 ema from bottom.
Regards
EMA=13,34,55
Buy condition when 13 ema will be on top, 34 ema will be in middle and 55 ema will be on bottom then only a buy signal will generate.
Sell condition when 13 ema will be on bottom 34 ema will be in middle and 55 ema on top then only a sell signal will generate.
SL of buying will be when 13 ema crosses the 34 ema from top and SL for selling will be when 13 ema crosses the 34 ema from bottom.
Regards
Sell = EMA(C,13)<EMA(C,34);
Short= EMA(C,13)<EMA(C,34) AND EMA(C,34)<EMA(C,55);
Cover= EMA(C,13)>EMA(C,34);
Plot( EMA( C,13), "13 EMA Close",ParamColor("EMA 13 Color", colorBlue ),styleNoRescale);
Plot( EMA( C,34), "34 EMA Close",ParamColor("EMA 34 Color", colorRed ),styleNoRescale);
Plot( EMA( C,55), "55 EMA Close",ParamColor("EMA 55 Color", colorBlack ),styleNoRescale);
Buy = ExRem(Buy,Sell);
Sell = ExRem(Sell,Buy);
Short=ExRem(Short,Cover);
Cover=ExRem(Cover,Short);
PlotShapes(IIf(Buy==1, shapeUpArrow , shapeNone), colorGreen, 0,Low, Offset=-20);
PlotShapes(IIf(Sell==1, shapeStar, shapeNone), colorRed, 0,High, Offset=30);
PlotShapes(IIf(Short==1, shapeDownArrow, shapeNone), colorRed, 0,High, Offset=-20);
PlotShapes(IIf(Cover==1, shapeStar, shapeNone), colorGreen, 0,Low, Offset=-30);
_SECTION_BEGIN("All in One Explorer - Manish");
i=0;
//52 Week High Low
High52 = HHV(High,250);
Low52 = LLV(Low,250);
//Bollinger Band
BB1=C>BBandTop(C,20,2) AND Ref(C,-1)<Ref(BBandTop(C,20,2),-1);
BB2=C<BBandBot(C,20,2) AND Ref(C,-1)>Ref(BBandBot(C,20,2),-1);
BBStatus=WriteIf(BB1,"Above Top",WriteIf(BB2,"Below Bottom",WriteIf(IsNull(MA(C,20)),"N/A","Neutral")));
BBColor=IIf(BB1,colorRed,IIf(BB2,colorGreen,colorLightGrey));
IIf(BB2,i+1,i);
//Moving Average (Short, Mid & Long Term)
MAShort = C>MA(C,15);
IIf(MAShort,i+1,i);
MAMid = C>MA(C,45);
IIf(MAMid,i+1,i);
MALong = C>MA(C,100);
IIf(MALong,i+1,i);
ShortStatus = WriteIf(MAShort,"Bullish",WriteIf(IsNull(MA(C,15)) ,"N/A","Bearish"));
ShortColor = IIf(MAShort,colorGreen,colorRed);
MidStatus = WriteIf(MAMid,"Bullish",WriteIf(IsNull(MA(C,45))," N/A","Bearish"));
MidColor = IIf(MAMid,colorGreen,colorRed);
LongStatus = WriteIf(MALong,"Bullish",WriteIf(IsNull(MA(C,100)) ,"N/A","Bearish"));
LongColor = IIf(MALong,colorGreen,colorRed);
//MACD
MACDBull=MACD(12,26)>Signal(12,26,9);
IIf(MACDBull,i+1,i);
MACDStatus=WriteIf(MACDBull,"Bullish",WriteIf(IsNull(MACD(12,26)),"N/A","Bearish"));
MACDColor=IIf(MACDBull,colorGreen,colorRed);
//Aroon
Period=14;
LLVBarsSince=LLVBars(L,Period)+1;
HHVBarsSince=HHVBars(H,Period)+1;
AroonDown=100*(Period-LLVBarsSince)/(Period-1);
AroonUp=100*(Period-HHVBarsSince)/(Period-1);
AroonOsc=AroonUp-AroonDown;
Aroon=AroonOsc>0;
IIf(Aroon,i+1,i);
AroonStatus=WriteIf(Aroon,"Bullish",WriteIf(IsNull (RSI(14)),"N/A","Bearish"));
AroonColor=IIf(Aroon,colorGreen,IIf(IsNull(RSI(14) ),colorLightGrey,colorRed));
//Stochastic
StochKBull=StochK(14,3)>StochD(14,3,3);
IIf(StochKBull,i+1,i);
StochKStatus=WriteIf(StochKBull,"Bullish",WriteIf( IsNull(StochK(14,3)),"N/A","Bearish"));
StochKColor=IIf(StochKBull,colorGreen,colorRed);
//RSI
R1=RSI(14)>30 AND Ref(RSI(14),-1)<30 AND Ref(RSI(14),-2)<30;
R2=RSI(14)<70 AND Ref(RSI(14),-1)>70 AND Ref(RSI(14),-2)>70;
IIf(R1,i+1,i);
RSIStatus=WriteIf(R1,"Improving",WriteIf(R2,"Decli ning",WriteIf(IsNull(RSI(14)),"N/A","Neutral")));
RSIColor=IIf(R1,colorGreen,IIf(R2,colorRed,colorLightGrey));
//MFI
M1=MFI(14)>80;
M2=MFI(14)<20;
IIf(M2,i+1,i);
MFIStatus=WriteIf(M1,"Overbought",WriteIf(M2,"Over sold",WriteIf(IsNull(MFI(14)),"N/A","Neutral")));
MFIColor=IIf(M1,colorRed,IIf(M2,colorGreen,colorLightGrey));
TrendScore =
IIf(BB2,1,0)+
IIf(MAShort,1,0)+
IIf(MAMid,1,0) +
IIf(MAMid,1,0) +
IIf(MALong,1,0)+
IIf(MACDBull,1,0) +
IIf(Aroon,1,0) +
IIf(StochKBull,1,0)+
IIf(R1,1,0) +
IIf(M2,1,0) ;
/*
TrendScore =
IIf(C>=Ref(C,-11),1,-1)+
IIf(C>=Ref(C,-12),1,-1)+
IIf(C>=Ref(C,-13),1,-1)+
IIf(C>=Ref(C,-14),1,-1)+
IIf(C>=Ref(C,-15),1,-1)+
IIf(C>=Ref(C,-16),1,-1)+
IIf(C>=Ref(C,-17),1,-1)+
IIf(C>=Ref(C,-18),1,-1)+
IIf(C>=Ref(C,-19),1,-1)+
IIf(C>=Ref(C,-20),1,-1);
*/
Filter = 1;
//AddColumn(High52,"52 Week High");
//AddColumn(Low52,"52 Week Low");
AddColumn(C,"Close",1,IIf(C>Ref(C,-1),colorGreen,colorRed));
AddColumn(V,"Volume",1,IIf(V>Ref(V,-1),colorGreen,colorRed));
AddTextColumn(BBStatus,"BBand",1,colorWhite,BBColor);
AddTextColumn(ShortStatus,"Short MA(15)",1,colorWhite,ShortColor);
AddTextColumn(MidStatus,"Mid MA(45)",1,colorWhite,MidColor);
AddTextColumn(LongStatus,"Long MA(100)",1,colorWhite,LongColor);
AddTextColumn(MACDStatus,"MACD",1,colorWhite,MACDColor);
AddTextColumn(AroonStatus,"Aroon",1,colorWhite,AroonColor);
AddTextColumn(StochKStatus,"Stochastic",1,colorWhite,StochKColor);
AddTextColumn(RSIStatus,"RSI(14)",1,colorWhite,RSIColor);
AddTextColumn(MFIStatus,"MFI(14)",1,colorWhite,MFIColor);
AddColumn(TrendScore,"Score");
_SECTION_END();
Hi all I want Open Interest Exploration in this formula can any budy please.
Last edited:
Need spread calculation for pair trading
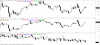
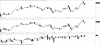
I need to chart spread between two scrips, eg axisbank minus icicibank.
This OHLC candlestick chart should give me difference between two scrips and should plot like any other scrip.
It should calculate - when during the day the difference was highest and lowest and capture those values as HIGH and LOW of the day.
For OPEN and CLOSE, it should just subtract OPEN of one scrip to OPEN of another and same for CLOSE.Same for HIGH and LOW
Example of how it looks is uploaded.
Pls help
Warm Regards
Jigish
Attachments
-
 39.8 KB Views: 730
 -
 14.1 KB Views: 718
hello good job im intersting about this afl but icant to download it plz i need any another llink or update this file thanks alot am aperciate u r effort
- Status
- Not open for further replies.
| Thread starter | Similar threads | Forum | Replies | Date |
|---|---|---|---|---|
|
|
My visual effect afl collection. | AmiBroker | 185 | |
|
|
AFL Collection by Tamil Trader | AmiBroker | 10 | |
| P | AFL Collection without formula references FUTURE quotes | AmiBroker | 1 | |
|
|
My amibroker afl collections | AmiBroker | 18 | |
|
|
The Grand AFL Collection Thread | AmiBroker | 20 |
Similar threads
-

-

-
AFL Collection without formula references FUTURE quotes
- Started by pareshbhangale
- Replies: 1
-
-
