Hi Ramash,
just curious, what is the color of the swing line in your chart??
try to change the background color of your chart, or else post code..
regards
ashutosh
hi ashutosh,
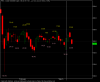
thanks for your reply. am new to afl's. started writing few. came across gann swing chart afl here. and i tried it with ami. i have attached the screenshort of rpl above. I give u the code here. have not changed anything other than the values color display from your prev code.
I use black as my back ground color.
kindly clarify me.
ramash
_SECTION_BEGIN("Price");
SetChartOptions(0,chartShowArrows|chartShowDates);
_N(Title = StrFormat("{{NAME}} - {{INTERVAL}} {{DATE}} Open %g, Hi %g, Lo %g, Close %g (%.1f%%) {{VALUES}}", O, H, L, C, SelectedValue( ROC( C, 1 ) ) ));
Plot( C, "Close", ParamColor("Color", colorBrightGreen ), styleNoTitle | ParamStyle("Style") | GetPriceStyle() );
_SECTION_END();
_SECTION_BEGIN("gannswingchart");
/* Gann Swing chart v4 */
/* Last modified 24 Feb 2001 */
/* AFL implementation by */
/* (C)2001 Tomasz Janeczko */
/* one and two - bar reversal version */
/* Change this to 1 for two-bar mode */
twobarmode = 0;
outsidebar = Outside();
insidebar = H <= Ref( H, -1 ) AND L >= Ref( L, -1 ); // built-in inside() works with < > instead of <= >=
upbar = H > Ref( H, -1 ) AND L >= Ref( L, -1 );
downbar = L < Ref( L, -1 ) AND H <= Ref( H, -1 );
upbar2 = upbar OR ( outsidebar AND Ref( downbar, 1 ) ) ;
downbar2 = downbar OR ( outsidebar AND Ref( upbar, 1 ) );
Poi = outsidebar AND Ref( insidebar, 1 );
Poo = outsidebar AND Ref( outsidebar, 1 );
Pooi = Poo AND Ref( insidebar, 2 );
Poio = Poi AND Ref( outsidebar, 2 );
Poii = Poi AND Ref( insidebar, 2 );
Pooo = Poo AND Ref( outsidebar, 2 );
Poooi = Pooo AND Ref( insidebar, 3 );
Pooio = Pooi AND Ref( outsidebar, 3 );
Poioo = Poio AND Ref( outsidebar, 3 );
upbar3 = upbar2 OR ( Poi AND Ref( downbar, 2 ) );
downbar3 = downbar2 OR ( Poi AND Ref( upbar, 2 ) );
upbar4 = upbar3 OR ( Poo AND Ref( upbar, 2 ) );
downbar4 = downbar3 OR ( Poo AND Ref( downbar, 2 ) );
upbar5 = upbar4 OR ( Pooi AND Ref( upbar, 3 ) );
downbar5 = downbar4 OR ( Pooi AND Ref( downbar, 3 ) );
upbar6 = upbar5 OR ( Poio AND Ref( upbar, 3 ) );
downbar6 = downbar5 OR ( Poio AND Ref( downbar, 3 ) );
upbar7 = upbar6 OR ( Poii AND Ref( downbar, 3 ) );
downbar7 = downbar6 OR ( Poii AND Ref( upbar, 3 ) );
upbar8 = upbar7 OR ( Pooo AND Ref( downbar, 3 ) );
downbar8 = downbar7 OR ( Pooo AND Ref( upbar, 3 ) );
upbar9 = upbar8 OR ( Poooi AND Ref( downbar, 4 ) );
downbar9 = downbar8 OR (Poooi AND Ref( upbar, 4 ) );
upbar10 = upbar9 OR ( Pooio AND Ref( downbar, 4 ) );
downbar10 = downbar9 OR ( Pooio AND Ref( upbar, 4 ) );
upbar11 = upbar10 OR ( Poioo AND Ref( downbar, 4 ) );
downbar11 = downbar10 OR ( Poioo AND Ref( upbar, 4 ) );
fupbar = upbar11;
fdownbar = downbar11;
// Two-bar mode handling
fupbar = IIf( twobarmode, fupbar AND Ref( fupbar, 1 ), fupbar );
fdownbar = IIf( twobarmode, fdownbar AND Ref( fdownbar, 1 ), fdownbar );
/* Barcount since most recent up and down swings */
Us = BarsSince( fupbar );
Ds = BarsSince( fdownbar ) ;
Sd1 =IIf( Us==0, 1, IIf( Ds==0, -1, 0) );
Sd2 = IIf( Sd1 == 1, IIf( Ref( BarsSince(Sd1==1), -1) > Ref( BarsSince( Sd1 == -1), -1), 1, 0),
IIf( Sd1 == -1, IIf( Ref( BarsSince(Sd1==1),-1) < Ref( BarsSince( Sd1 == -1),-1), -1, 0), 0 ) );
g0 = ValueWhen( Sd2, Sd2 ); /* sample and hold non-zero values */
/* shift back one bar, add one dummy swing at the end and shift forward */
/* to ensure proper handling of the last swing */
lastbar = Cum(1) == LastValue( Cum(1) );
swinglevel = IIf( g0 == -1, HighestSince( Sd2 == 1, H ), LowestSince( Sd2 == -1, L ) );
swinglevel = IIf( lastbar, IIf( g0 == -1, LowestSince( Sd2 == -1, L ), HighestSince( Sd2 == 1, H )), Ref( swinglevel, 1 ) );
/* Gann Swing chart drawn here */
Graph1 = Ref( ValueWhen( Ref( Sd2 != 0, 1 ) OR lastbar, swinglevel , 0 ), -1 );
Graph1Style = 512+1024;
GraphXSpace = 10;
dist = 1.0*ATR(25);
for(i = 1; i <= BarCount - 1; i++){
IIf(swinglevel
== swinglevel[i -1], txtVal = 0 , txtVal = swinglevel - swinglevel[i-1]);
Cntp = BarsSince(Cross(sd2, 0));
Cntn = BarsSince(Cross(0, sd2));
txtValStr = NumToStr(abs(txtVal), 1.2);
if(txtVal > 0) PlotText("" + txtValStr, i-(Cntp+2)/2, swinglevel[ i ] + dist[ i ], colorYellow);
if(txtVal < 0) PlotText("" + txtValStr, i-(Cntn+2)/2 , swinglevel[ i ] - dist[ i ], colorYellow);
}
/*
dist = 0.5*ATR(25);
for(i=1;i<=BarCount - 1; i++)
{
IIf(swinglevel == swinglevel[i-1], txtVal = 0, txtVal = swinglevel-swinglevel[i-1]);
txtValStr = NumToStr(abs(txtVal), 1.2);
if(txtVal >0) PlotText("" + txtValStr, i, swinglevel + dist, colorYellow);
if(txtVal < 0) PlotText ("" + txtValStr, i-1, swinglevel - dist, colorPink);
}
/* //Colourized price bars drawn here
Graph0 = Close;
Graph0Style = 128;
barcolor = IIf( outsidebar, 1, IIf( downbar, 4, IIf( upbar, 5, 0 ) ) );
Graph0BarColor = ValueWhen( barcolor != 0, barcolor );
_SECTION_END();