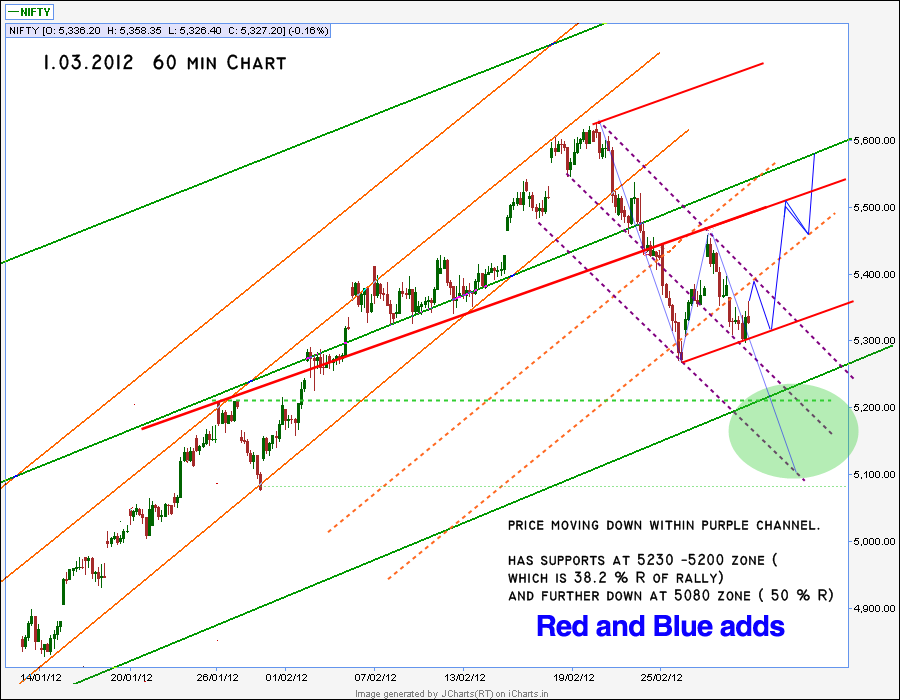
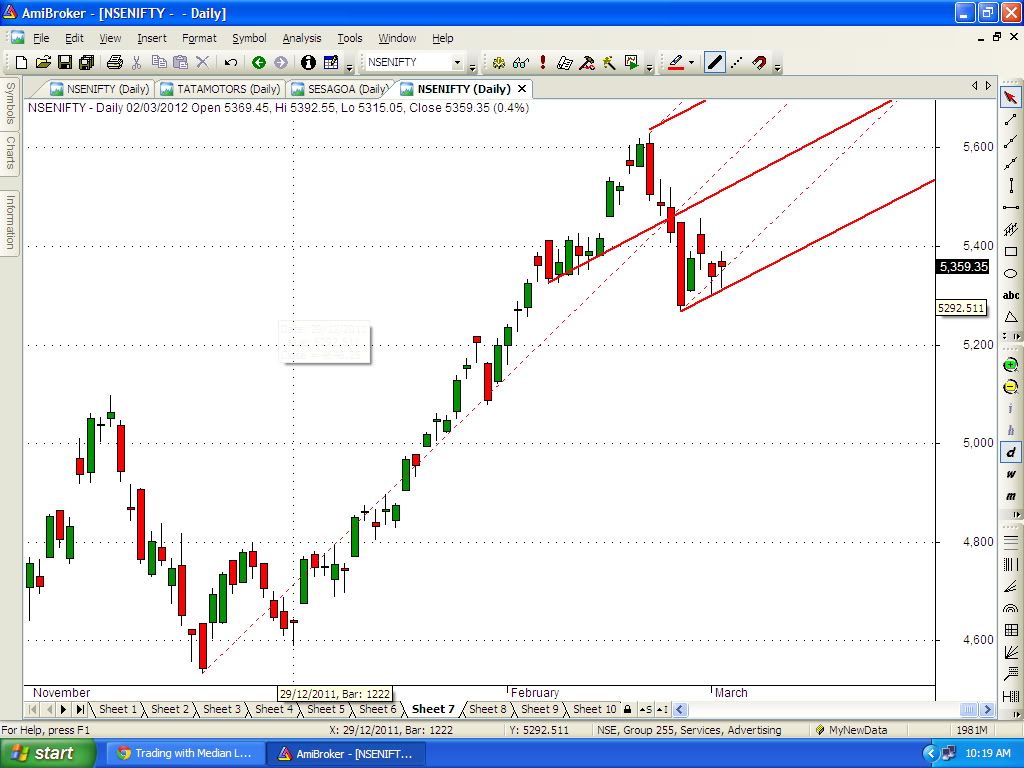
Kavima..thick red lines...are they drawn correct?
Hi Hawaisanjay
For Andrews PF model , we need to choose the pivots where there has been a significant reversal in price to project a channel ,which can indicate the probable supports and resistances . The choice of pivots without any reversal in direction in the TF may not indicate the S/R levels for the future swings.
In your chart the 1st pivot chosen to draw the thick red median line is not suitable for the same reason.The dotted line PF can be considered for analysing the price bar moves.The last two red bars have been projecting below the LMLH ..indicating the supports are not yet confirmed at the LMLH and the trend is still down.
Scenario 1...the next bar closes positive higher than these bars,we wait for another second bar to retest the LMLH and again close positive to confirm that a reversal in direction has commenced. Targets will be the median line / previous highs.
Scenario 2 ...Since the ST trend is still down ...we can short the breakdown of the recent 2 red bars as then the bars are moving out of the LMLH support.Targets will be warning lines drawn parallel to the LMLH.


