


NIFTY FIFTY
- Thread starter AMITBE
- Start date
- Status
- Not open for further replies.
AMITBE said:
Like what?
Try to substantiate.
IF you're trying to say there'll be a fall again, no rocket science there.
Clearly there is buying happening and not short coveriung, including Fiiday.
As for midcaps, today was the first broad based rally in quality counters across sectors...and I would not be surprised if the recent lows on many of them don't get retested again. The big fish will protect their positions and will absorbe supply.
I still feel this pullback has more left in it...how much more can't say, but don't be surprised going ahead.
It is difficult to understand for me what u wanted say? Is maket going to fall again from tommorow? It is my sixth sense telling to me that market is going to fall again from tommorow.
wrgrds
Ahmed
amitt29 said:
Amitji,
lookin at near term picture,in terms of fall from 11/5 todays close is very significant,i feel if it goes above the high of Friday(tomorrow only)we may see the big rally.Even holding 2950(tomorrow)will bode good for the week.This week is important for the coming expiry week.
lookin at near term picture,in terms of fall from 11/5 todays close is very significant,i feel if it goes above the high of Friday(tomorrow only)we may see the big rally.Even holding 2950(tomorrow)will bode good for the week.This week is important for the coming expiry week.
Anyhow, there is sectoral rotation quite visibly, and the day started with cement majors. Index management counters in FMCG kept up above supply lines too.
We've closed above 200 DMA, and almost reached towards the 200 EMA.
These are important levels.
Further, new and strong buying has emerged in midcaps, and this new investment has to be protected too. This may even give us a clue if a bottom has indeed been created already? If so, I'd look forward to consolidation in time rather than price...possibly at or above the major moving averages?
Much depends on tomorrow, and at no point should the market slip significantly into the negative for any length of time...else there may be a sell off again.
For me this close is more pleasing than confusing.
mahmeds2000 said:
Hi amitbe,
It is difficult to understand for me what u wanted say? Is maket going to fall again from tommorow? It is my sixth sense telling to me that market is going to fall again from tommorow.
wrgrds
Ahmed
It is difficult to understand for me what u wanted say? Is maket going to fall again from tommorow? It is my sixth sense telling to me that market is going to fall again from tommorow.
wrgrds
Ahmed
")
Czar said:
thank you sir...lol
the falling trend line of this fall is somewhere around yesterday's high.. so I assumed, correct me if i'm mistaken sir...
the falling trend line of this fall is somewhere around yesterday's high.. so I assumed, correct me if i'm mistaken sir...
Also, in terms of where we were and where we are, the recent lows had pushed the Nifty to last Nov/Dec levels and now its at Jan/Feb levels, and on the charts it is an important support area.
I agree with you that another slam dunk is absolutely possible, but yesterdays broad rally in the midcap space gives a reason if not hope that some sort of bottom building may have happened recently: The percentage jump in closing values across the board in this segment shows the hand of big funds who gobbled up fantastic steals. Its very plausible that this priceline will be protected going ahead.
The other reason is, as mentioned yesterday afternoon, the way supply was being absorbed the last couple of sessions.
Sure, we are far from being out of the woods yet somewhere along the line we need to keep our eyes open to any signs of bottom building.
As for your Sixth Sense, Id written here yesterday morning that if Wednesdays high at 2767 is successfully retested, then the Fibonacci/retracement levels of the same days low at 2595 would be under grave threat.
Its a wait and watch.
The US markets didnt give much hope, so theres danger coming from there, and theres general weakness elsewhere too.
For supports the crucial line is 2913-2909-2906-2897-2891-2885-2881-2877-2869.
2853-2848 is critical.
To the up, the line to hold for any upside is 2926-2931-2936-2946-2951.
Will update again.
Attachments
-
 20.4 KB Views: 37
AMITBE said:
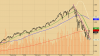
Hi Baronthe falling trendline in the attached chart shows a slight heads-up on Thursday June 15 close near the days high at 2799. This is where the trendline stands broken at this point. There may be an interesting contest at this trendline going ahead and Ill certainly update.
Also, in terms of where we were and where we are, the recent lows had pushed the Nifty to last Nov/Dec levels and now its at Jan/Feb levels, and on the charts it is an important support area.
I agree with you that another slam dunk is absolutely possible, but yesterdays broad rally in the midcap space gives a reason if not hope that some sort of bottom building may have happened recently: The percentage jump in closing values across the board in this segment shows the hand of big funds who gobbled up fantastic steals. Its very plausible that this priceline will be protected going ahead.
The other reason is, as mentioned yesterday afternoon, the way supply was being absorbed the last couple of sessions.
Sure, we are far from being out of the woods yet somewhere along the line we need to keep our eyes open to any signs of bottom building.
As for your Sixth Sense, Id written here yesterday morning that if Wednesdays high at 2767 is successfully retested, then the Fibonacci/retracement levels of the same days low at 2595 would be under grave threat.
Its a wait and watch.
The US markets didnt give much hope, so theres danger coming from there, and theres general weakness elsewhere too.
For supports the crucial line is 2913-2909-2906-2897-2891-2885-2881-2877-2869.
2853-2848 is critical.
To the up, the line to hold for any upside is 2926-2931-2936-2946-2951.
Will update again.
Pretty good for quiet consolidation for now.
If 2839 is breached, then 2814-2819 are threatened then 2796-2799.
Safety is above 2863-2867-2871.
Then above 2889 is congestion where only 2901 can give relief.
- Status
- Not open for further replies.
| Thread starter | Similar threads | Forum | Replies | Date |
|---|---|---|---|---|
| M | Nifty option strategy chart in Dhan Optiontrader | Brokers & Trading Platforms | 3 | |
| S | EOD data for Nifty 50 with volume | Introductions | 0 | |
| L | Nifty fifty and stock futures | Swing Trading | 13 | |
| M | Veluri Strategy intraday nifty fifty | Software | 96 | |
| T | Nifty Fifty Only + GOLD SILVER | Data Feeds | 0 |
Similar threads
-
Nifty option strategy chart in Dhan Optiontrader
- Started by MetatraderUser
- Replies: 3
-
-
-
-