


Almost every pair is coming out to be significant (even with significance =0.01),wipro:tatasteel,wipro:drreddy etc.
Is some normalisation /detrend etc. to be done on data?Asking this since I do not understand cointegration well enough.
Is some normalisation /detrend etc. to be done on data?Asking this since I do not understand cointegration well enough.
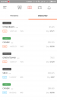
By the way did you check the significance on the stockdata file I had shared or have you made any updation ? I am getting the significance value as follows for the pairs you have quoted:
WIPRO:TATASTEEL --> 0.039
WIPRO-DRREDDY --> 0.041
Also do we have any inbuilt funtion in statsmodels that will create a matrix of significance ?
Btw nice thread.
Btw nice thread.
ok so pct_change has been used which will normalise the data.Am I correct?
Last edited:
 just added fridays close price in excel sheet