Price action with Candlestick Analysis(No indicators)

I'm not here to promote any website but, the one I came across might fit in your requirement.

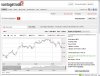
This site analyzes stocks based on trend and gives your Trend Indication along with targets and time frame on the candle stick charts.

In initial days, I used these charts and signals to reconfirm my analyzing skills as these calls proved to be reliable.

Let me know, if any one of you have any better charting tool or indicators to analyze stocks.
 

Attachments

hi hik,
nice thread. quite useful
one basic doubt which haunts me since long is:
there are 2 ways in which a position can be initiated eg in case of buying
a)buy on break of resistance ie when stock is showing strength
or b) when stock is at support level.

which one of the 2 is more safe and more effective?
any historical findings on this subject?
pl reply

regards
girish
 

mangup

Well-Known Member
cellclinic,

Unable to understand the attached charts & the indicators within. How u r plotting them n using for trade trigger? Can u pl explain with one e.g.?
 

cellclinic

Well-Known Member
Hello Bro ...

I am posting these intra charts just to get some advice or to share ideas for working on lower ( mine is 20 mins ) time frames with the support & resistance levels on higher time frames ...

Indicators are not important as i use them for intra confirmation but mainly the way i started trading & sharing is support & resistance levels only :)

Extremely sorry for indicators on charts posting as this thread is with no indicators :(

Just check the hourly chart & resistance levels on it & the 20 min is same time looks like @ 3.30 for just providing reference to trade on tomorrow ...

cellclinic,

Unable to understand the attached charts & the indicators within. How u r plotting them n using for trade trigger? Can u pl explain with one e.g.?
 

Similar threads