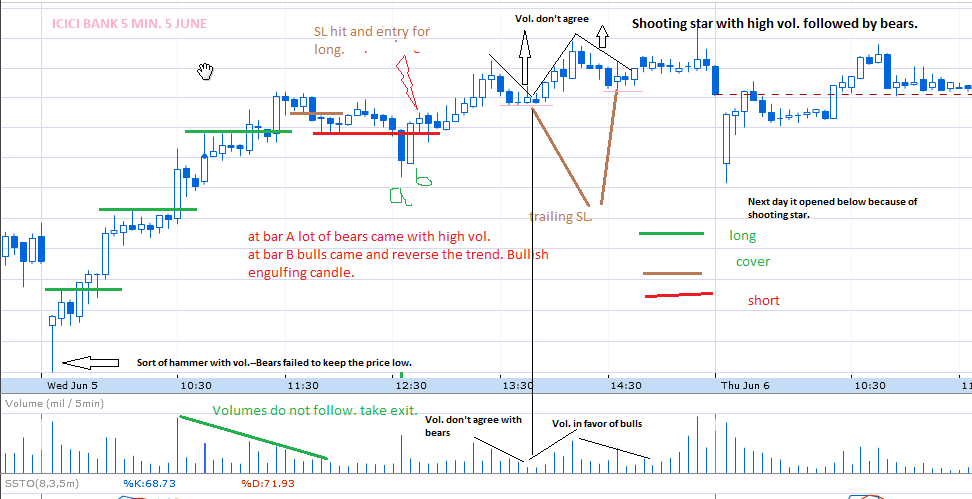
Price action with Candlestick Analysis(No indicators)

Raghuveer

Well-Known Member
Here is my analysis for JetAirways for today.
Thanks for the nice chart and analysis.
TJ forum has a quota/limit for charts hosted on TJ itself. Uploading charts to a different host avoids this quota problem.

To upload charts to a different host, please see post by timepass: "How to upload images/charts" or

When using Amibroker:
Edit -> Image -> Export to file.
Upload this png file and share the link.

When using MT4:
File -> Save As Picture and then copy paste the png/bbCode link in your post.

ShareX is a very convenient tool that makes uploading charts quite easy: http://www.traderji.com/software/78...lets-you-take-screenshots-traderji-forum.html
 
Last edited:
Some price action from me. Please recommend how can I improve.
Here is my analysis for JetAirways for today.
This is really nice guys. Can you do this analysis on higher timeframes... say like for an index like NF or BNF over the period of the last sideways phase? Like Dec , nov, jan. I really want to know more ... but i dint understnd the posts about the other forum. Please hint which forum...
 

Vertigo_1985

Well-Known Member
This is really nice guys. Can you do this analysis on higher timeframes... say like for an index like NF or BNF over the period of the last sideways phase? Like Dec , nov, jan. I really want to know more ... but i dint understnd the posts about the other forum. Please hint which forum...

can you be little more clear on timeframe of the chart and duration of the analysis ?
 

Raghuveer

Well-Known Member
------------deleted---------------------
 
Last edited:
Yes raghuveer, pm not enabled. what number of posts do u need to get it enabled? I need to get name of that forum

Thanks for analysis Vertigo. Will try to go through and understand it. I should have posted volume with the chart. I am really impressed with ur chart. how do I study this way of analysis so i can do it myself?
 
Dear friends,
I need to print out for every 30mins close price for wholedays chart of every stock and commodity. How can I take the print out from amibroker?
Please anybody help me for that afl.
 

Similar threads