Some of my forecasts

Status
Not open for further replies.
Now that the LT target of .9390 has been hit, this market has begun to correct some of its losses. Like many of the USD pairs that are correcting, the weekly has strong corrective implications, but the monthly is weighing heavily for the trend to continue. The only problem with the AUD/USD si that the weekly stochastics do not agree, and it reverses in the middle of the cloud. The fact it is buried so far under the daily cloud tells me some sort of correction is bound to take place before it continues lower.
A look at the weekly shows the bottom of the cloud is merging north and will be at .9538 2 weeks from now which also warns of some northeast activity in the future.


Mr paul aud/usd a great monthly support was hit at 0.9392, The bottom of the weekly cloud has given out and I think a reversal has begun! weekly stoch has gone sideways! I am not able to look for any possible containment ! I am looking for the minimum 4 hour kinjun at 0.9632 to be hit !
 
Re: Usd/chf

Nice observation with the chinkou. It was buried a long ways under the candles, then finally recovered back to them. The candles are kind of acting like R for the chinkou. which means the reversal has to begin over the next 8 days.

The chinkou is also another ichimoku equilibrium study. We view the markets with how far price action has drifted from the cloud or from the tenken and kijun. WE can also see how far the chinkou has drifted from the candles. In essence, no reversal will take place until the markets have reached full equilibrium. The weekly is showing now that complete equilibrium has been met, it is now ready to reverse.
Now another form of equilibrium needs to be met, and that is the tenken and kijun.
With the 2 R's that are evident on the weekly, another one to consider is the .9392 monthly kijun.


Mr paul, I am glad I though the same thing! I noticed that level it was a 500 pip movement in some minutes that was some crazy moves! by looking at the pair it seems like it heading for 0.9417, this price has some very good weekly cloud support! also stoch is overbought and has moved side ways in respect to the weekly, to add to it the tk/tj and chikou seems to have almost come to a point where they have met without a crossover with each other and is ready for a complete downwards shift ! this price also levels up with the monthly kinjun, overall trend is bearish and the future clouds indicate no sign of bulls so therfore strong reversal are coming !
 
Now that the LT target of .9390 has been hit, this market has begun to correct some of its losses. Like many of the USD pairs that are correcting, the weekly has strong corrective implications, but the monthly is weighing heavily for the trend to continue. The only problem with the AUD/USD si that the weekly stochastics do not agree, and it reverses in the middle of the cloud. The fact it is buried so far under the daily cloud tells me some sort of correction is bound to take place before it continues lower.
A look at the weekly shows the bottom of the cloud is merging north and will be at .9538 2 weeks from now which also warns of some northeast activity in the future.
good morning mr paul,Currently the pair is sitting at 0.9587 so most probably the pair to be lower at 0.9538 in 2 weeks than the current level! weekly stoch for this pair is oversold and has moved sideways!
 
This is what I meant when I said the market will travel northeast over coming weeks. In order to maintain proper cloud structure, the pair could move as high as 1.0075. reverse to the .9587 point, and then the bounce officializes from that point.

A really nice thing about ichimoku is that it allows us to see and pinpoint certain price actions before they happen. We can see that in the future we are about to have some broad range consolidation before another strong move. Here in about 6 weeks, you will be able to go to many sites, and there so-called professionals will talk about how the market is in broad range consolidation.
LOL, it's almost not fair. The ichimoku can make us look so smart.

good morning mr paul,Currently the pair is sitting at 0.9587 so most probably the pair to be lower at 0.9538 in 2 weeks than the current level! weekly stoch for this pair is oversold and has moved sideways!
 
Re: Usd/chf

Nice observation with the chinkou. It was buried a long ways under the candles, then finally recovered back to them. The candles are kind of acting like R for the chinkou. which means the reversal has to begin over the next 8 days.

The chinkou is also another ichimoku equilibrium study. We view the markets with how far price action has drifted from the cloud or from the tenken and kijun. WE can also see how far the chinkou has drifted from the candles. In essence, no reversal will take place until the markets have reached full equilibrium. The weekly is showing now that complete equilibrium has been met, it is now ready to reverse.
Now another form of equilibrium needs to be met, and that is the tenken and kijun.
With the 2 R's that are evident on the weekly, another one to consider is the .9392 monthly kijun.
Mr paul from the post what do you mean by full equilibrium ?please explain this equilibrium stuff and how does it work with ichimoku! Acoording to me you mean that when the price has shifted to far from the chikou ,tenken and kinjun there will be a pullback to the level , like on the weekly the chikou is almost near the candle and the tk/tj have merged ! these resistance signs are evidence for a reversal and a hit to the monthly kinjun at 0.9392 confirm a reversal? did you mean this mr paul?
 
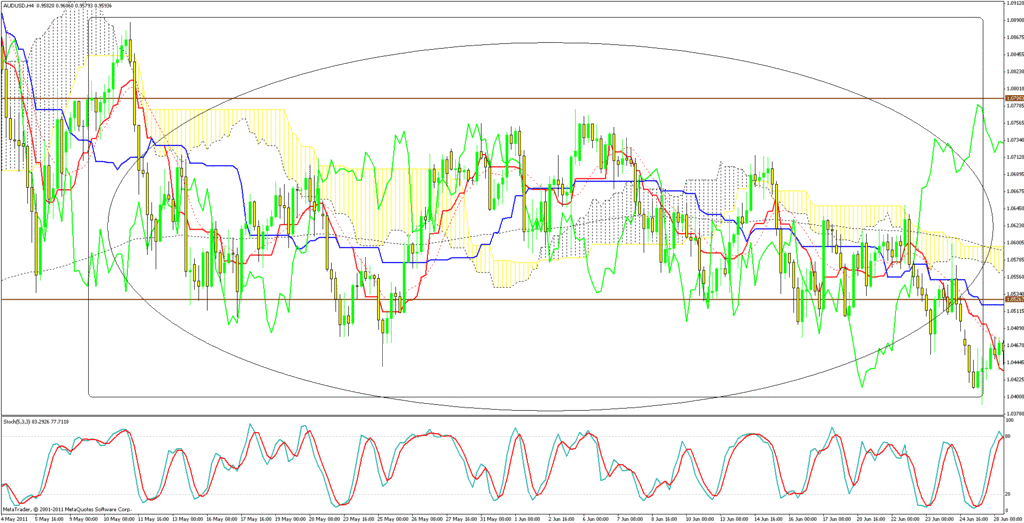
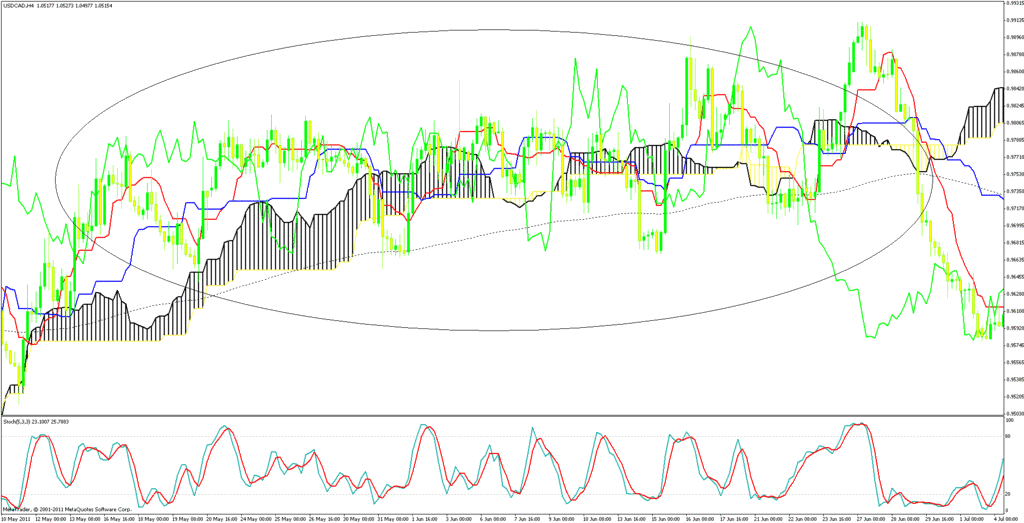
Mr paul! indeed you are correct ichimoku can make us look smart lol but from the word "consolidation" that you have mentioned I am forced to show you a chart I have zoomed out a bit I hope you can view them clearly , and as How do you trades when the market goes like this? at these moments There is no clear view , I don't understandand most of the time I end up getting my stop loss triggered --


Re: Usd/chf

That's right! You can look at equilibrium as equality. The perfect state for price action to be in is the state of equality. This is the state of affairs the Aussie weekly is in, as it is not inside the cloud. As traders, we look for one of 2 basic things: 1. A break out of the equality zone, namely the cloud; 2. When price has deviated so far from equality, then we look to position ourselves to trade back to equality.

There is a very key point that needs to be made here. I do get a chuckle when someone asks me, "What TF do you trade?" In order to make the most accurate trading decisions, all of them need to be considered. Whether someone is a scalper, daytrader, or position trader is another story. Personally, I take my positions based on what is obviated. In this case, the EUR/USD is clearly headed further north, so I want to grab all the pips I can.
In the case of the GBP/JPY, I see some quick pips that will be made once 120.81 is broken, so I will position myself for a trade that cold last a few hours. If the break is the real deal, then I'll close the trade after the quick pips, wait for the correction back to 120.81, and then initiate a longer term trade from there.

Mr paul from the post what do you mean by full equilibrium ?please explain this equilibrium stuff and how does it work with ichimoku! Acoording to me you mean that when the price has shifted to far from the chikou ,tenken and kinjun there will be a pullback to the level , like on the weekly the chikou is almost near the candle and the tk/tj have merged ! these resistance signs are evidence for a reversal and a hit to the monthly kinjun at 0.9392 confirm a reversal? did you mean this mr paul?
 
My rule in trading comes down to a personal confidence ratio that I put on the trade. If I am not 90% certain that trade is going my way, then I'm staying away. It is time to go shopping somewhere else.

I cannot see what this market is, as I did not take time to copy and zoom in on the chart. There are also many variables that could be addressed. A lot of times the hourly will look like this chart when the weekly is getting ready to reverse, or the 4-hour will look like it, when the monthly is getting ready to turn around. OTOH, if it is the monthly or weekly that looks like this, then tone the microscope down to the smaller TF's.
When the USD/CAD was headed south, it appeared on the monthly from Nov. '09 to Dec. '10 to being heading due east. I had so many excellent trades on the loonie, but like the kid at the candy store, this was like M&M's instead of a 3 Musketeers bar. Regardless, they taste good!
Simply put, the overall proclivity, until the market gave me further notice was south. During that time, I took the microscope to the hourly and 4-hour. I waited for an entry at one of those extreme levels, then jumped in. I found the water was fine many times. but most of those trades were quick in-outers that lasted 1 or 2 days making from 50-150 pips at a time.

I said all that to say there are the many variables that are involved. Take the opportunities as they come. Refuse the position if it does not match your confidence criteria. It is always much better to be out wishing you were in, then to be in wishing you were out.
Yeah, yeah . I know the best scenario is being in and smiling big when you get out.


Mr paul! indeed you are correct ichimoku can make us look smart lol but from the word "consolidation" that you have mentioned I am forced to show you a chart I have zoomed out a bit I hope you can view them clearly , and as How do you trades when the market goes like this? at these moments There is no clear view , I don't understandand most of the time I end up getting my stop loss triggered --


Gbp/usd


Uploaded with ImageShack.us

Here's a nice chart with regards to the ichimoku cloud and price action, and also a different kind of confluence.
Price entered the cloud. It is expected to stay in the cloud. Price went north, and then east. This is especially so on the hourly chart that when there is eastward motion, the break, almost invariably will be in the direction of the trend. Trend was UP to get there, and so it will break the upper regions of the consolidative pattern.
Here's the difference in the pips that are made off of a trade like this. Many people look at a consolidative pattern, and then want to trade the break, whichever way it will go. Isn't it good to know that we now have the knowledge the next break will be to the upside? So, current level is a nice area to take a long position because it is at the bottom of the pattern. In retrospect this is the hourly pattern, so wait for the break on the hourly, take the huge, quick move, then get out.
Position traders would see the implications on the weekly, then see this pattern on the hourly and then with confidence, take this trade to ride out the more MT uptrend (In this case, "uptrend" refers to the correction of the larger downtrend.).

BTW, you silent viewers, we would love to here your inputs and have you participate. All this ichimoku talk is relevant as far as "Some of my forecasts" are concerned. These same principles can be applied to all markets, which, of course, includes Nifty.

I'm also still working at getting a demo that includes Nifty. I will entertain all suggestions.
 
Status
Not open for further replies.
Thread starter Similar threads Forum Replies Date
J Introductions 2
U Forex 2

Similar threads