


system trading is best if used Systematically
- Thread starter abhiwhy
- Start date
don't worry
make this expert
write in bullish trend section
Mov(CLOSE,3,EXPONENTIAL)>Mov(CLOSE,13,EXPONENTIAL)
and in bearish
Mov(CLOSE,13,EXPONENTIAL)>Mov(CLOSE,3,EXPONENTIAL)
in ribbon section
in bullish select green
in bearish select red
in pattern select none
in pattern select none
type in lebels bull
and bear respectively
go to highlight section
select new
select colour blue or any of ur choice
copy paste formula
ADX(14)>Mov((ADX(14)),9,SIMPLE)
name the expert trend run
u have the expert ready.
abhi:thumb:
sir i dint got this adx part where to paste it
my dear abhiwhy,
thanks for introducing this system for us. I understand this system is eme 3,13,34 but some place in yr post 2 u have mentioned as 315. Plz clear the doubt. Iam mainly a day trader with 2 lots of mini nifty but carry to if in heavy loss. Presenly seriously thinking to c/o some position for a week or 2. I find ur system will help me to do so. Iam using pib & doing whole time trade at my home. I dont have ami or any source of rt data other than pib which does not allow 2 plot past data. Can i import ur meta export file & get the charts u have given in post 11& 13 ? Pardon me if my queries looks too silly. Iam nil in technical & my age (58+) is not on my side. Hence, i may raise simple queries. I hope u wont mind. Your system is so simple any lay man like me can do profitable trading. Am i wright? All the best of luck & happy trading. Thanks again........sm
thanks for introducing this system for us. I understand this system is eme 3,13,34 but some place in yr post 2 u have mentioned as 315. Plz clear the doubt. Iam mainly a day trader with 2 lots of mini nifty but carry to if in heavy loss. Presenly seriously thinking to c/o some position for a week or 2. I find ur system will help me to do so. Iam using pib & doing whole time trade at my home. I dont have ami or any source of rt data other than pib which does not allow 2 plot past data. Can i import ur meta export file & get the charts u have given in post 11& 13 ? Pardon me if my queries looks too silly. Iam nil in technical & my age (58+) is not on my side. Hence, i may raise simple queries. I hope u wont mind. Your system is so simple any lay man like me can do profitable trading. Am i wright? All the best of luck & happy trading. Thanks again........sm
that u use 315, 515 0r 313 ,all work in similar way but i was talking about 313 technique you don't need to worry about charting software serch google for amibroker download trial version and see data section in traderji to feed it with eod data all indicators are available here and i would sooner present ami afl on this technique so make it automated, don't hesitate to ask questions ,it doesn't look silly to me , i m also indiabulls user
and for sure sir , it is not going to fulfill any requirements of a trader . You need togo beyond it.
Abhi
dear abhiwhy,
your system and your way of explaining is nice. Only to capture big trends and escape from whipsaws you have made your system.highly appreciated. But i observed in amibroker it was giving very few signals. For example in nifty as per your system, after exiting june 10th from long, no signal sofar.
I am a positional trader. I am following technical patterns. As per my setups so many stocks are ready to fall and to brake their support levels from their congestion zones. But when i scan as per your system i got only 3 or 4 stocks.as per my observation except this, everything is nice and it was a good system. In my opinion a trader must take in to account of support and ressistance lines before entering in to trade as per this system.
involve greater amount of capital and make larger positions to ride the trend for a trader like u an me , i m designing the another system.
Presently there is no trend neither bullish nor bearish its a range bound market and index is moving up -down between support and resistance , thats why this system is avoiding these minor movements,
u may think 200-400 nifty points are un avoidable but it is at decision point if breaks the resistance level it may touch 5500 or 6500 or more or in downward direction also it has huge potential to go downside so why not to ride the major rally instead of these minor movements.
Brother abhi, Figures look fantastic in ur attached file. If U plz mention date of Long & Cover against each trade that will help us ( ID Trader) to understand for how long to hold for excellent return which u have achieved. Plz oblize. Thanks & happy trade.........SM
OK .
ABHI
can u post one of ur chart
because i am not geting adx indicator on chart screen
because i am not geting adx indicator on chart screen
U ARE NOT GOING TO SEE THE ADX IN CHART VIEW PREVIOUS CHARTS I HAVE POSTED AND WAY TO USE IT HAS BEEN MENTIONED OVER CHART IN RED COLOR TAKE A LOOK IF PROBLEM PERSISTS ASK AGAIN.
ABHI
HI FRIENDS SOME MISTAKE WAS THERE THE EXCEL SHEET I POSTED EARLIER WAS OF ANOTHER SYSTEM I M EXPERIMENTING
HERE I M PRESENTING TRADING DATES AND TRUE PAYOFF DETAIL FROM THIS TECHNIQUE
DATES ARE
1) 19/06/07 LONG : 4732
18/07/07 EXIT :5351 ( PROFIT =619)
2)16/01/08 SHORT : 5935
15/02/08 EXIT : 5302 (PROFIT=633)
3)30/5/08 SHORT :4739
10/07/08 EXIT :4162 (PROFIT =577)
4)16/09/09 SHORT :4074 (PROFIT=932)
04/01/09 EXIT :3142
5)24/03/09 LONG :2938 PROFIT(1491)
08/06/09 EXIT :4429
TOTAL PROFIT =4252
LOSS =0000000000
THERE ARE INDEED SOME MINOR NEGATIVE AND POSITIVE SIGNALS WHICH U WOULD LEARN IGNORING AFTER SOME PRACTICE AS I HAVE DONE .
I WAS PAPER TRADING IT TILL 24/3/09 BUT FORTUNATELY I WAS IN THE BEST MOVE IT SHOWN BUT I LEFT FAITH IN IT AND BOOKED PROFIT 0F 500 POINTS ONLY AND IT WAS A BIG MISTAKE .
WE R ALSO GOING TO DISCUSS HOW TO IGNORE THESE MINOR MOVEMENTS ON SYSTEM ,AND THATS WHY WE R IN THIS THREAD TO SYSTEMTICALLY
TRADE THE SYSTEMS .
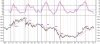
FOR BETTER UNDERSTANDING I M PRESENTING THE CHART SHOWING POSITIONS AND DATES
ALSO REMEMBER ONE IN CHART TRADING HAVE BEEN DONE FROM BLUE LINE TO RED AND NEVER FROM RED TO BLUE
HAPPY TRADING
ABHI
HERE I M PRESENTING TRADING DATES AND TRUE PAYOFF DETAIL FROM THIS TECHNIQUE
DATES ARE
1) 19/06/07 LONG : 4732
18/07/07 EXIT :5351 ( PROFIT =619)
2)16/01/08 SHORT : 5935
15/02/08 EXIT : 5302 (PROFIT=633)
3)30/5/08 SHORT :4739
10/07/08 EXIT :4162 (PROFIT =577)
4)16/09/09 SHORT :4074 (PROFIT=932)
04/01/09 EXIT :3142
5)24/03/09 LONG :2938 PROFIT(1491)
08/06/09 EXIT :4429
TOTAL PROFIT =4252
LOSS =0000000000
THERE ARE INDEED SOME MINOR NEGATIVE AND POSITIVE SIGNALS WHICH U WOULD LEARN IGNORING AFTER SOME PRACTICE AS I HAVE DONE .
I WAS PAPER TRADING IT TILL 24/3/09 BUT FORTUNATELY I WAS IN THE BEST MOVE IT SHOWN BUT I LEFT FAITH IN IT AND BOOKED PROFIT 0F 500 POINTS ONLY AND IT WAS A BIG MISTAKE .
WE R ALSO GOING TO DISCUSS HOW TO IGNORE THESE MINOR MOVEMENTS ON SYSTEM ,AND THATS WHY WE R IN THIS THREAD TO SYSTEMTICALLY
TRADE THE SYSTEMS .
FOR BETTER UNDERSTANDING I M PRESENTING THE CHART SHOWING POSITIONS AND DATES
ALSO REMEMBER ONE IN CHART TRADING HAVE BEEN DONE FROM BLUE LINE TO RED AND NEVER FROM RED TO BLUE
HAPPY TRADING
ABHI
Attachments
-
 98 KB Views: 666
| Thread starter | Similar threads | Forum | Replies | Date |
|---|---|---|---|---|
|
|
The Best Trading System | Words of Wisdom | 520 | |
| M | Best system for day trading ?? | MetaStock | 3 | |
| C | Worlds Best Trading System | AmiBroker | 7 | |
| F | Intraday trading system-best scalping indicator now available | AmiBroker | 17 | |
| F | Best Live Automated Trading System of 2013 | Algo & Automated Trading | 0 |
Similar threads
-

-
-
-
Intraday trading system-best scalping indicator now available
- Started by ford7k
- Replies: 17
-
Best Live Automated Trading System of 2013
- Started by forexforever
- Replies: 0