NIFTY INTRA DAY
13 Feb
Disclaimer : These notes/comments have been prepared solely to educate those who are interested in the useful application of Technical Analysis. While due care has been taken in preparing these notes/comments, no responsibility can be or is assumed for any consequences resulting out of acting on them.Trading in Stocks/Commodities/Futures Carry Risk.Consult your financial advisor only before you trade.
CNX NIFTY 6,001.10 -82.90 -1.36 %
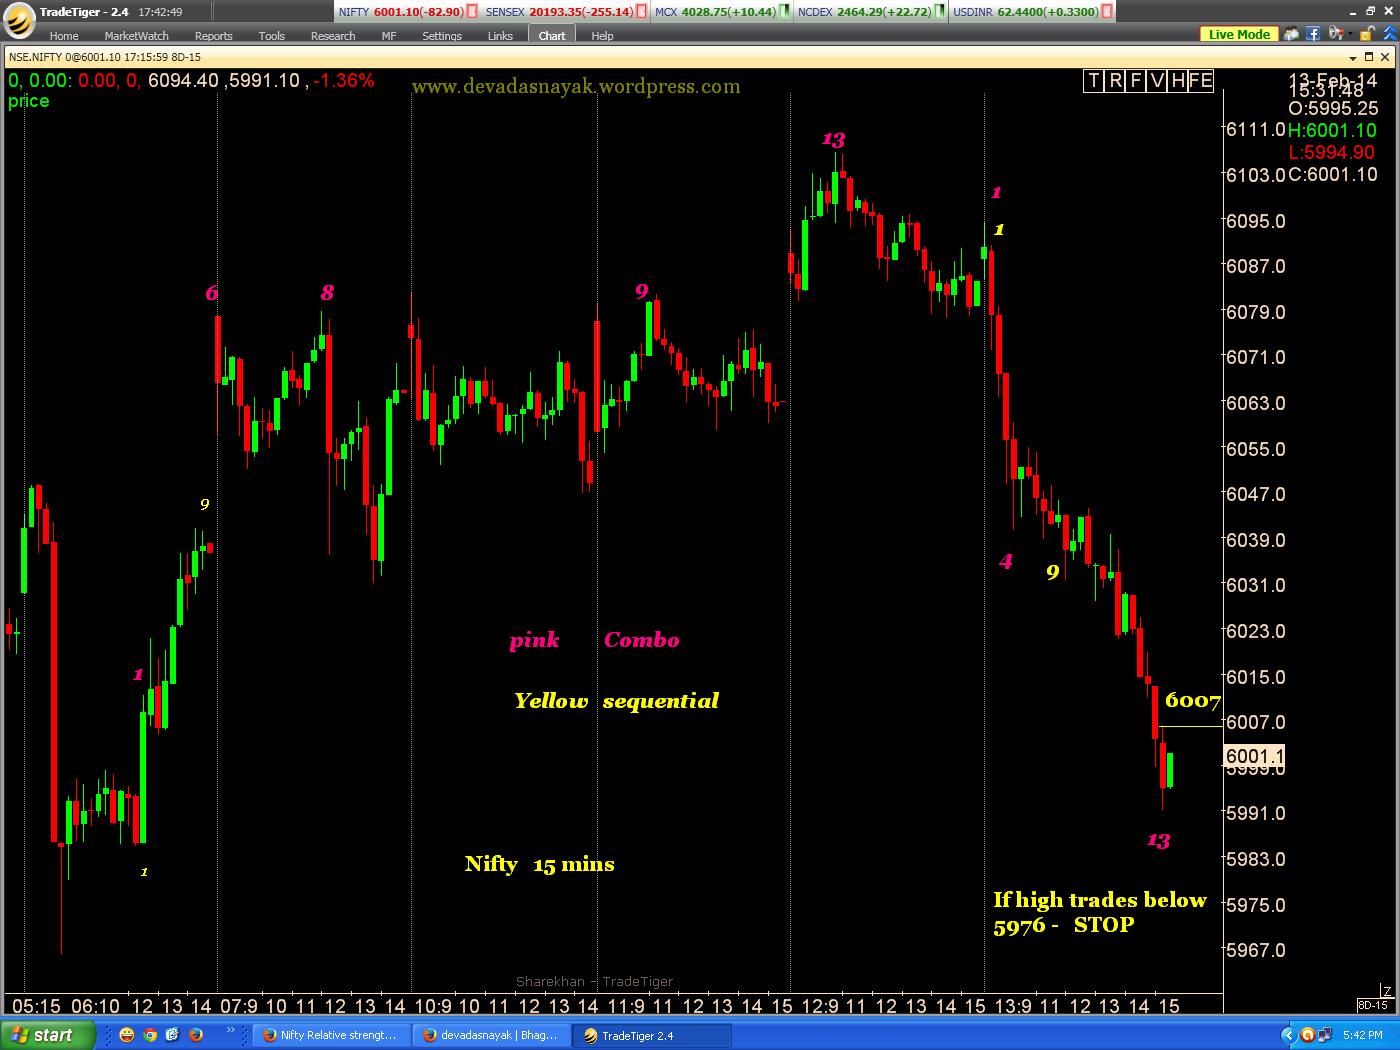
Nifty 15 min chart is depicted below.It has completed a TD Combo 13sell signal on 15 minute chart, which was the reason of fall today.Also it has completed a buy setup and TD Combo buy.One can go long above 6007, provided the high of 15 minute bar is not below 5976.
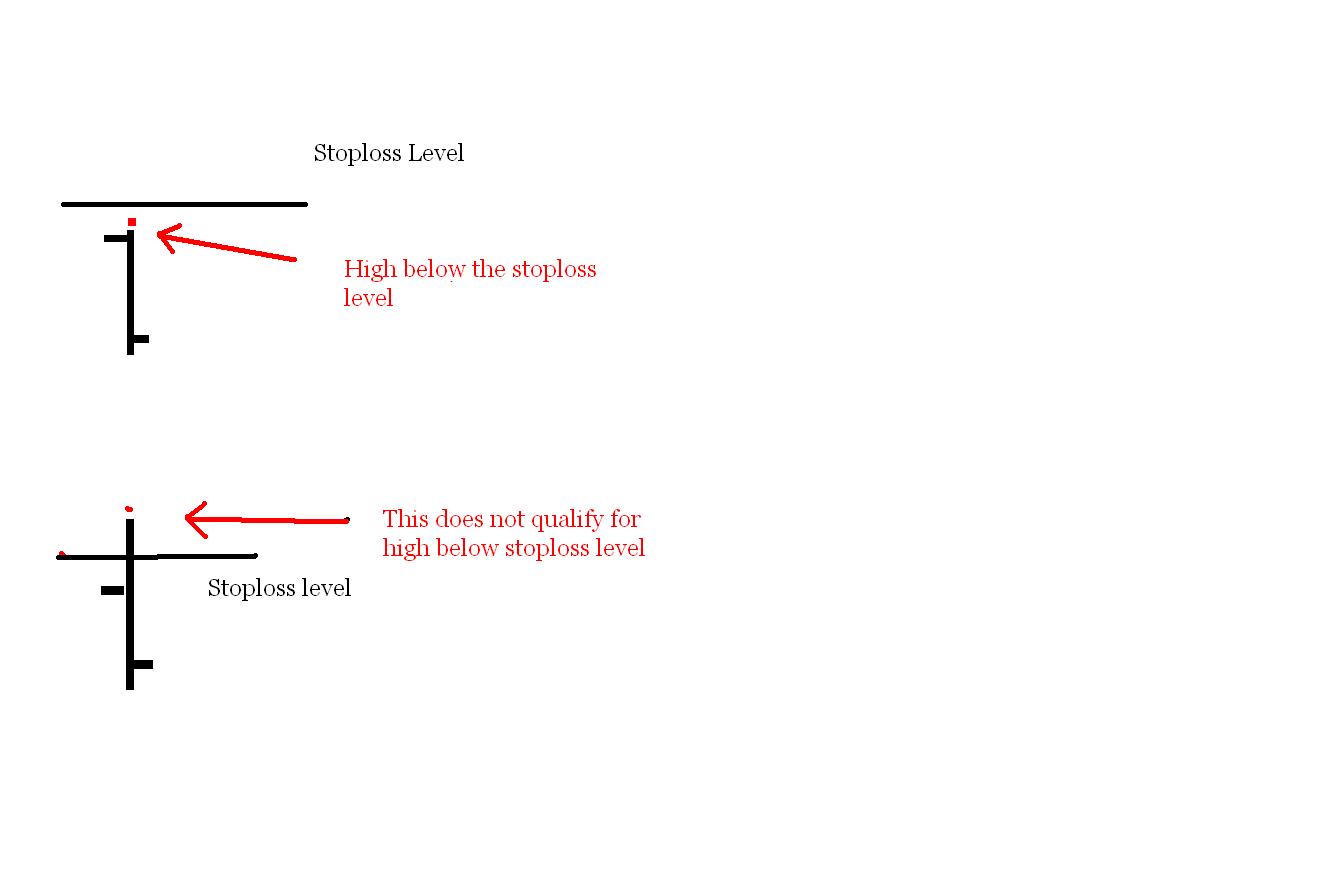
(Warning : I am discussing about 15 min bar / candle and not daily high / low One should use Live charts while trading these setups).Also this is only for intra day trading.
If market opens lower and then crosses 6007 and the high of any 15 min bar ( after it crosses 6007) does not go below, 5976 then it is a valid signal.The moment any 15 min bar high goes below 5976, then stop is triggered.
Do not try this system if you are not well versed with the above mentioned terminology and chart markings.
NIFTY 15 minute Chart


