hi Aw10,
I m not much of a fundamentalist, i lost interest in that a long time ago, but i do keep bird eye view on this so i will try mine best to give the answer by the articles i found very informative on internet.
To add some historical perspective to our collective analysis of Gold, I offer the following information. I apologize for not having charts for these, but I haven't been able to find historical for the USDX since its formation in 1973, after the dismantling of the Brenton Woods system.
Moreover, there are many experienced chartists on this forum, who, if interested, could do a much better LT EW analysis than I ever could. I only hope to that proficient one day.
The USDX chart I've posted goes back to January 1999, when the Euro was officially added to the USDX.
I chose March 1976 as my starting point for what I call Modern Gold, because that is when all major world currencies were floated, i.e fiat money.
Highlighted in red are potential Fibonacci retracements for these Gold and USDX supercycles, along with a Fibonacci retracement for Gold from 1999 -2008. Again, I chose January 1999 because of the readjustment of the USDX and the fact that Gold traded flat from 1999 until 2001, when the Gold bull run started.
Gold (1976 - 2008) Fibonacci
1011.00
132.00
1011.00 100.00
803.56 76.40
675.22 61.80
571.50 50.00
467.78 38.20
339.44 23.60
132.00 0.00
Gold (1999 - 2008) Fibonacci
1011.00
255.00
1011.00 100.00
832.58 76.40
722.21 61.80
633.00 50.00
543.79 38.20
433.42 23.60
255.00 0.00
USDX (1973 - 2008) Fibonacci
165.00
71.32
165.00 100.00
142.89 76.40
129.21 61.80
118.16 50.00
107.11 38.20
93.43 23.60
71.32 0.00
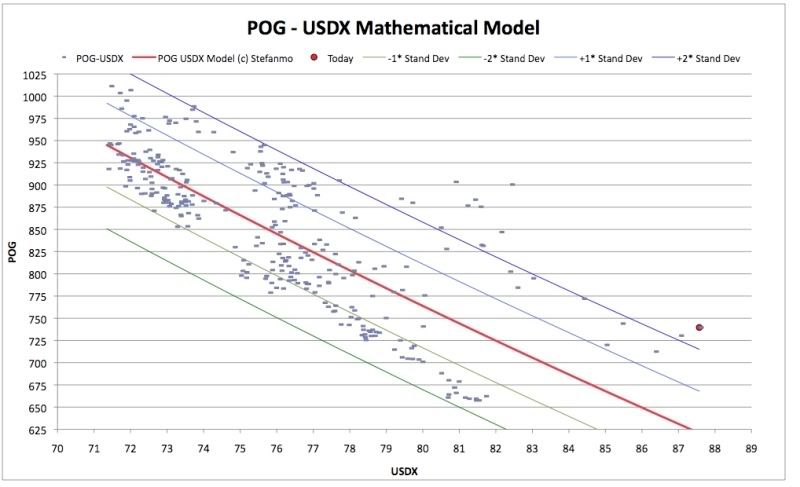
The next chart was developed by a member on the GoldisMoney forum, which models the POG to USDX, as a detemination of the true value of the price of gold.
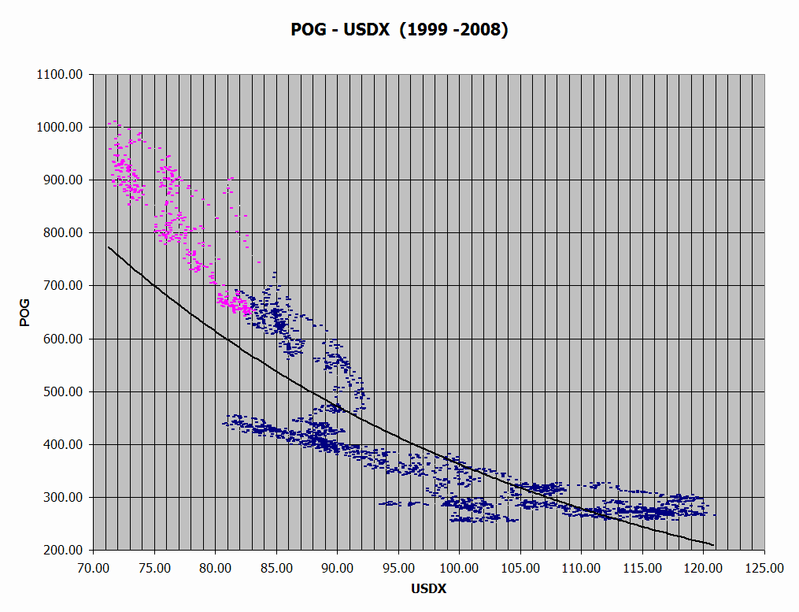
I find it very useful, due to the strong correlation between POG and USDX, and I decided to investigate his results over a longer time frame, with the following charts....
Highlighted in pink on my chart are the last 380 trading days, which roughly estimates his time frame. All of these points are well above the trendline, which suggests that Gold has a long way to come down in price.
Now, don't get me wrong, I'm not a gold bear, because I honestly believe that the monetary policies of the US government are misguided, and might potentially lead to an economic collapse of the USD. But the reality of the historical data shows strong evidence of the USDX trending upward off a new low, and that cannot be good POG without price decoupling.
Perhaps the data is revealing an attempt to do just that, but I have two more charts of interest.....
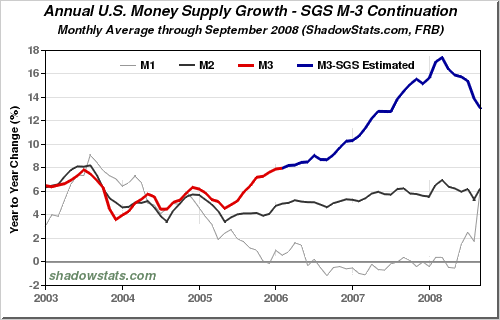
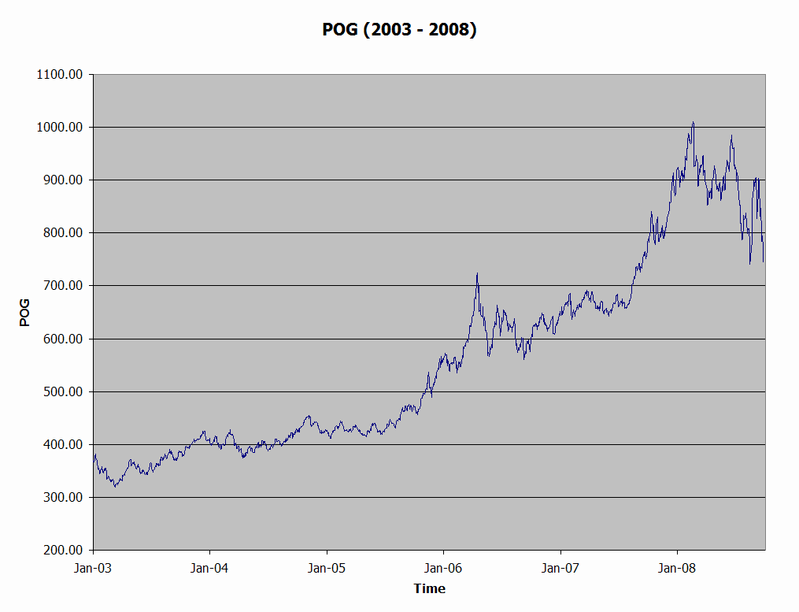
What's interesting to note is that the year to year pecent change in the M3, the broadest measure of the total US money supply, and the POG are moving together.....
Notice the M3 peak in March 2008 corresponds with the peak in Gold....
Granted, the data for M3, since March 2006, are only estimations because the US government stopped reporting this information, and the only data now only available from third party sources at a cost, but you get the idea....
As more dollars are printed, the dollar has devalued and gold as moved upwards accordingly. Now, with the US government turning up the printing pressing to full speed, in an attempt to add liquidity to the financial markets, one would expect POG to skyrocket, yet the USDX's increasing value is confounding the analysis.
One possibility is that the USDX did not bottom yet, and this is bear market rally, and it will retest .71 and establish a historic new low. Here's the rub, if this is the case, how far will it drop and will the USD maintain its global hegemony?
Historically, the USDX is in uncharted territory, and any prediction of a USDX bottom would require a high caliber EW chartist, and a little more data.
Hopefully, someone on this forum is up to the challenge....
That being said, I believe this to be the case, and the USDX will retrace back to at least .93, and quite possibly 1.07, before heading back down. Gold will have strong supports at 675 - 633 - 571 - 544, then the party will begin.
The models suggest it could go much lower than that, but IMVHO these are remote possiblities, because I do not foresee it heading up past that to touch the 50 or 61.8 Fibonacci retracements because the US government has added way too much liquidity to the financial markets, even with the lag time necessary for it to filter into the system.
Now, it's all about time frame.....You're guess is as good as mine, which is why I find it deplorable that certain people find it justifiable to post anonymous attacks that only serves to drive away talented EW chartists whose knowledge we all can benefit from.
IMO, those who have lost money in the markets based on someone else's analysis get what they deserve. NO ONE IS RIGHT ALL THE TIME!!!
These are interesting times we're living in, and hopefully, we can all prosper during them, with the help of information, sound fundamental and technical analysis, and the wisdom to realize that contrarian opinions are a good thing, because it helps us keep a proper perspective.
"A man convinced against his will, is of the same opinion still" -- Dale Carnegie
"Any fool can criticize, condemn, or complain, and most fools do." -- Dale Carnegie
"America ....where you are free, to do as they tell you." -- Bill Hicks


