Re: 1 lakh to 652 lakhs in 497 trading days - Winning 20% of Trade in NIFTY Futures -
Tool for Option Trading.
Somebody in the thread (I think it is Option.Trader) who was asking for a Option Trading Tool... I was not able to download the Options chain data before. But the NSEIndia Options Chain data seems to be available for Excel download. So the question to the Option Trading Experts on the Rules to be followed...
Please confirm my understanding so that I can develop the tool in line with the following rules....
We will use the following Data
1. Strike Price - SP
2. Call Open Interest Change - CEOI
3. Call LTP - CELTP
4. Put Open Interest Change - PEOI
5. Put LTP - PELTP
Rules.
For CALL Options
1. For Each Strike Price, if CEOI > 0 and CELTP > 0 then "LONG BUILD"
2. For Each Strike Price, if CEOI < 0 and CELTP < 0 then "LONG UNWIND"
3. Else Flag the Strike as "FLAT"
For PUT Options
4. For Each Strike Price, if PEOI > 0 and PELTP > 0 then "SHORT BUILD"
5. For Each Strike Price, if PEOI < 0 and PELTP < 0 then "SHORT UNWIND"
6. Else Flag the Strike as "FLAT"
After the abiove rules, We will have one of the Following for CALL Options
LONG BUILD, LONG UNWIND or FLAT
After the above rules, We will have one of the Following for PUT Options
SHORT BUILD, SHORT UNWIND or FLAT
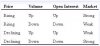
Then for each Strike Price a Combination of CALL and PUT should give the effective direction of the strike
CALL Result & PUT RESULT = Effective Result
FLAT + FLAT = FLAT
FLAT + SHORT BUILD = BEAR
FLAT + SHORT UNWIND = BULL
LONG BUILD + FLAT = BULL
LONG BUILD + SHORT BUILD = FLAT
LONG BUILD + SHORT UNWIND = STRONG BULL
LONG UNWIND + FLAT = BEAR
LONG UNWIND + SHORT BUILD = STRONG BEAR
LONG UNWIND + SHORT UNWIND = FLAT
After the above for each strike price we will have either FLAT or BULL or BEAR or STRONG BULL or STRONG BEAR
At 2:05 PM, If I apply the above logic I am getting net result as FLAT with a slightly BEARISH.
The maximum Open Interest for CALL is at 6000 and for PUT it is at 5800... In the last 2 -3 days Heavy Open interest is seen from 5500, 5600, 5700 and 5800 Puts
Please put your thoughts so that I can include this in the next version of the MTP tool. I will want to do this first for NIFTY and we can extend this for any Stock.
On top of this we can use other stuff like
1. Theoretical Price Vs Market Price - If market price is cheaper than the Theoretical price then it would be good to buy. Vice versa for selling.
2. We can also use Implied Volatily (IV) to choose our strategies. For Retail traders who usually Buy Options... The General rule on IV is to buy Options only when IV is low. Once again what is low is questionable. So we can calculate the Average IV for the day and choose the strike if the IV is less than Average IV. (IV is in fact derived from Theoretical and Market price). The market price would be normally higher than the Theorectical price. But if it goes below the Theorectical price then it might be a Opportunity to Buy.
Some of the Options Recommendations that could be automated based on IV are
IV Low and Market Bearish - Buy Naked PUTs
IV Low and Market FLAT - Buy Straddles and Strangles
IV Low and Market Bullish - Buy Naked CALLs
When the IV is Neutral - Do nothing - Do not Trade
When the IV is High - Good for selling - So it would be the reverse of the IV Low
IV High and Market Bearish - Sell Naked CALLs
IV High and Market FLAT - SELL Straddles and Strangles
IV High and Market Bullish - SELL Naked PUTs
There are more complex strategies like Spreads, Butterflies which would be difficult to Automate.