


BollingerBands
- Thread starter columbus
- Start date

EOD=5.7.13 NIFTY last few months
========= =================

http://www.traderji.com/day-trading/87914-emastrips-bb-modified.html#post819611
========= =================
http://www.traderji.com/day-trading/87914-emastrips-bb-modified.html#post819611
A little new to indicators and other tools that are used. Fairly familiar with candle patterns, first attempt at learning to use these tools.....so kindly bear with me if I am being overly slow with grasping things...
I have seen a few videos on BB and how to use them, never really understood it, until I hit upon this thread. It is starting to make some sense now, in terms of how it is used....thanks to columbus and the others.
The image is a chart of Reliance industries for 1st July 2013. A few questions popped up....I hope someone can clarify....
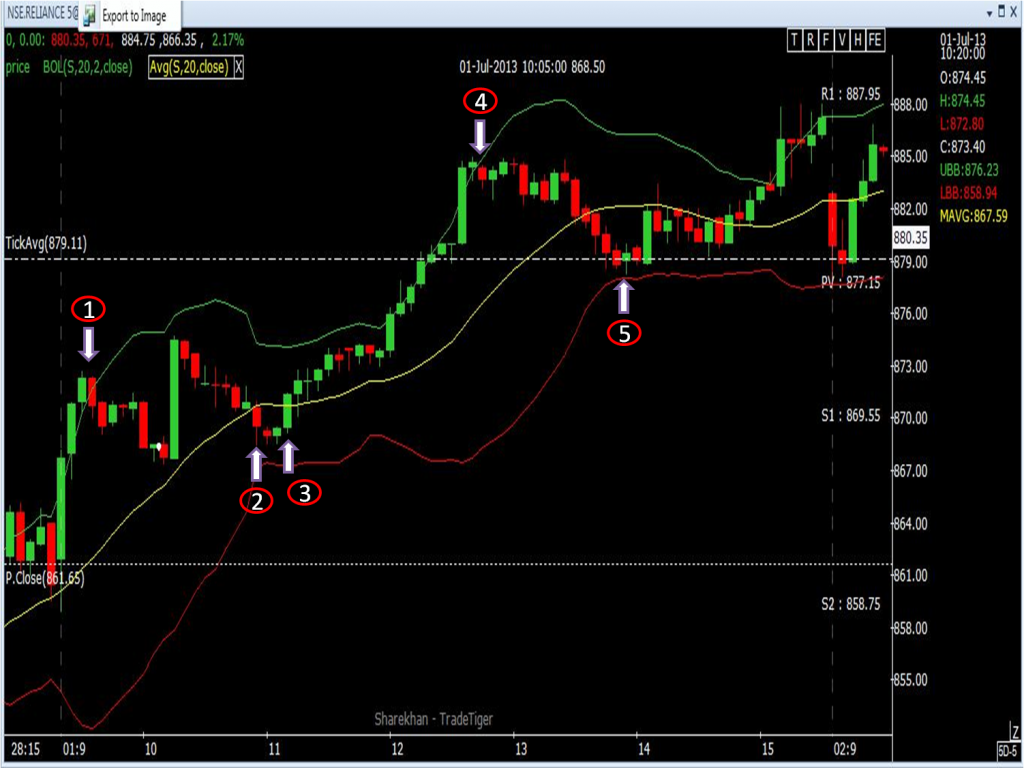
Point 1: Green candle cuts upper BB line, next candle is a red candle....signalling a short.
Point 2: A possible exit for short position, assuming I treat the middle SMA 20 line as resistance......
Point 3: definitely exit short position, the two small candles, between the arrows, have the same low price. Treating it as a resistance, exit short position.
Point 4: Another green candle cutting the upper BB followed by a red candle, signalling a short.
Point 5: Exit the short position and take home the days hunt....
Question 1: The short taken at Point 1 would have been scary, cos a big green candle was formed between Point 1 and Point 2. It would have triggered a stop loss (set at 1% higher than the price i go short at) since it closed at a day's high at that time....roughly 10:15...
It did meet the criteria, but did not behave properly...is there any other indicator that can counter this false signal ??
Question 2: The upper and lower BB banders are resistance and support lines......do we treat the centerline, the 20 SMA also as a resistance or support line ??
thanks
I have seen a few videos on BB and how to use them, never really understood it, until I hit upon this thread. It is starting to make some sense now, in terms of how it is used....thanks to columbus and the others.
The image is a chart of Reliance industries for 1st July 2013. A few questions popped up....I hope someone can clarify....
Point 1: Green candle cuts upper BB line, next candle is a red candle....signalling a short.
Point 2: A possible exit for short position, assuming I treat the middle SMA 20 line as resistance......
Point 3: definitely exit short position, the two small candles, between the arrows, have the same low price. Treating it as a resistance, exit short position.
Point 4: Another green candle cutting the upper BB followed by a red candle, signalling a short.
Point 5: Exit the short position and take home the days hunt....
Question 1: The short taken at Point 1 would have been scary, cos a big green candle was formed between Point 1 and Point 2. It would have triggered a stop loss (set at 1% higher than the price i go short at) since it closed at a day's high at that time....roughly 10:15...
It did meet the criteria, but did not behave properly...is there any other indicator that can counter this false signal ??
Question 2: The upper and lower BB banders are resistance and support lines......do we treat the centerline, the 20 SMA also as a resistance or support line ??
thanks
Hi raasaa,
Thanks for a detailed graph and queries.
Let me discuss ,the case of Taking a BUY at Lower Band.
In that case let us take Middle line as TARGET.1 and Top line as Target.2.
Liquidate portion of your position at Target.1.Now the question is "HOW MUCH
PERCENTAGE?"It depends on many factors like your earnings in that particular
day,the amount of time left in the day, etc....But in any case if you are
profited handsomely either by GAP UP/GAP DOWN ,immediately liquidate your
entire portion because almost entire day is at your disposal .(Personal experience).
Not only after 1 but also after 5 ,you saw a BIG candle.It is sheer bad luck.
You have to accept it.Have a look at my thread "Bollingerworm" also.
http://www.traderji.com/day-trading/48558-bollingerworm.html#post822217
Columbus,
Thanks for your reply and clarifications. Happy to know that I understood it correctly, in using the center line as a resistance / support line
Bollinger worm has my brain in knots...will take me a few days to fully understand that...thanks for the link
Few more questions though...
1) Only if the green candle cuts and closes above the top BB line, followed by a red candle, is it considered a trigger
OR
If the high of the green candle cuts the top BB line, followed by a red candle...can also be taken as a trigger ??
and vice versa for the lower BB line....
2) Are any signs to predict whether the price will cross the centerline (resistance/support) and reach the upper or lower BB lines....other than candlestick patterns ??
3) I am sorry if you have already covered this elsewhere, I might have missed it......The BB bands give very different signals when viewed on a 5 min and 15 min chart. The range of band in itself is different...with the 5min band looking more sensitive in my opinion.
Is there any recommended time frame that you suggest for using BB bands, you seem to use 3min ticks for most of your charts...or is it entirely up to individual preference ?
Raasaa,
1.(Green candle cuts the Top BB + followed by Red candle) is considered as
TRIGGER.
(This issue is better tackled in BollingerWorm because ema-2h should come in
BB.This means same as 1.)
2.No.Heikin Ashi candles will help a bit in this regard.(If available in your trading
software).
3.15min Time Frame is too big.I prefer 3min to 5 min.Not more than that.
thanks columbus
Heikin ashi....you are continually throwing curve balls in my direction
So far I have been playing it safe, waiting for a green candle to close above the top BB line, followed by a red candle.....and confirming it RSI and MACD indicators....worked well today in two trades.
I am going to spend the next few days digesting the bollinger worm and EMA band topics that you have posted.....hopefully that will help refine what I am already doing...
btw, I use trade tiger....not sure if it can plot heikin ashi candles.....can it ??
reply except that WE WILL TRY TO INTRODUCE IN FUTURE VERSION.
Any way since you are doing fine ,continue with the same set-up.


| Thread starter | Similar threads | Forum | Replies | Date |
|---|---|---|---|---|
| B | _bollingerbands overlay | AmiBroker | 0 |