Daily Analysis By FXGlory

GBPAUD H4 Technical and Fundamental Analysis for 09.19.2024


Time Zone: GMT +3
Time Frame: 4 Hours (H4)


Fundamental Analysis:
The GBPAUD pair represents the British Pound (GBP) against the Australian Dollar (AUD), both of which are influenced by central bank policies and global economic conditions. Today, the GBP faces significant news with the release of the Bank of England's Monetary Policy Summary and voting breakdown, which could provide insight into the central bank's stance on interest rates. Hawkish sentiments from the Bank of England could strengthen the GBP, leading to potential bullish momentum. On the AUD side, employment data and the unemployment rate are key market-moving events for today. Better-than-expected Australian employment figures could bolster the AUD, adding downward pressure on the pair. Both currencies are subject to central bank guidance and economic data, making today critical for GBP AUD price movements.


Price Action:
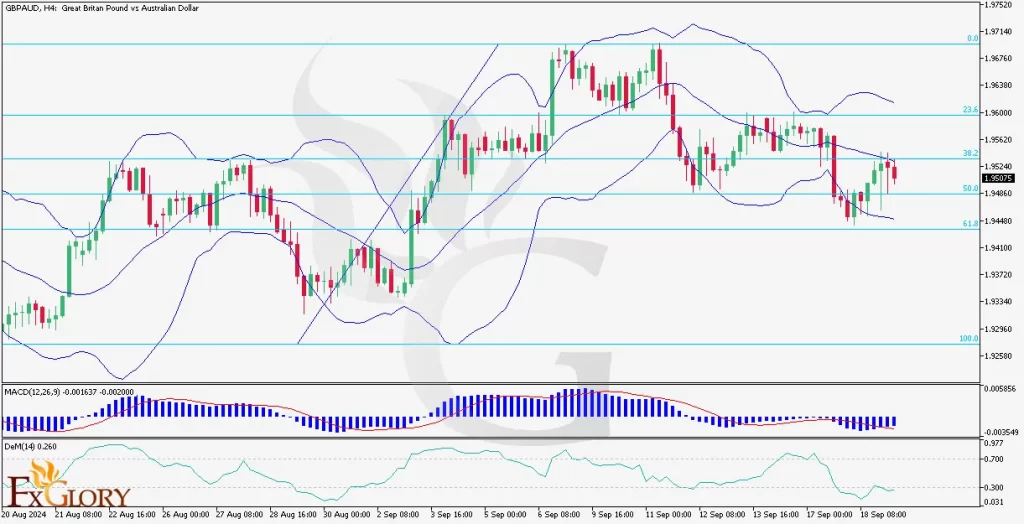
On the H4 timeframe, the GBP/AUD pair is currently showing bearish tendencies, as seen from the last two candles that have declined. The price is trading between the 38.2% and 50.0% Fibonacci retracement levels, indicating potential support near the 50.0% level. The GBPAUD Price action shows movement toward the lower half of the Bollinger Bands after briefly touching the middle band. This suggests a potential downward continuation. If the price breaks below the 50.0% Fibonacci level, we could see further bearish momentum.


Key Technical Indicators:
Bollinger Bands:
The price has been moving from the lower band toward the middle band but is currently heading back toward the lower band. This indicates a bearish move, with volatility expected to increase as the price approaches the lower Bollinger Band. If the price remains in the lower half of the bands, it may continue on a downward path.
MACD (Moving Average Convergence Divergence): The MACD histogram is showing decreasing momentum, with the MACD line slightly below the signal line. This suggests bearish momentum is building, and traders should watch for a potential continuation of the downward trend if the MACD crosses further below the signal line.
DeMarker (DeM) (14): The DeMarker indicator currently sits at 0.260, which is below the neutral zone, indicating that the pair is nearing oversold conditions. While this suggests that the selling pressure could slow down, it also signals that there may be room for further bearish movement before a possible reversal.


Support and Resistance Levels:
Support:
Immediate support is found at the 50.0% Fibonacci retracement level at approximately 1.9502. Further support can be seen near the 61.8% Fibonacci level at 1.9440.
Resistance: Immediate resistance is near the 38.2% Fibonacci level at 1.9562. Stronger resistance lies at 1.9600, aligning with the upper Bollinger Band.


Conclusion and Consideration:
In conclusion, the GBP AUD pair on the H4 chart shows signs of bearish momentum with the price moving toward the lower half of the Bollinger Bands and declining MACD momentum. The DeM indicator nearing oversold territory signals potential for a short-term reversal, but the overall bearish outlook remains dominant. Traders should watch key support and resistance levels, particularly around the 50.0% and 38.2% Fibonacci levels, for signs of a breakout or reversal. With important economic data releases from both the UK and Australia, heightened volatility is expected, making it crucial for traders to monitor these indicators closely.


Disclaimer: The GBPAUD H4 provided analysis is for informational purposes only and does not constitute financial advice. Traders should perform their own analysis and consider market conditions before making any trading decisions. Markets can change rapidly, and staying updated with the latest news is essential for successful trading.


FXGlory
09.19.2024
 
USDCAD H4 Technical and Fundamental Analysis for 09.20.2024


Time Zone: GMT +3
Time Frame: 4 Hours (H4)


Fundamental Analysis:
The USD/CAD forex pair is influenced today by key fundamental events from both the U.S. and Canada. In the U.S., the market anticipates remarks from Federal Reserve Bank of Philadelphia President Patrick Harker at Tulane University. Traders will be watching for any hawkish signals regarding future monetary policy, which could strengthen the USD. On the Canadian side, Bank of Canada Governor Tiff Macklem is scheduled to speak at the National Bureau of Economic Research conference in Toronto. His commentary could provide insights into future interest rate policies, impacting the CAD. Additionally, the release of retail sales data and industrial product prices from Canada could drive market volatility depending on how the actual figures align with market forecasts.


Price Action:
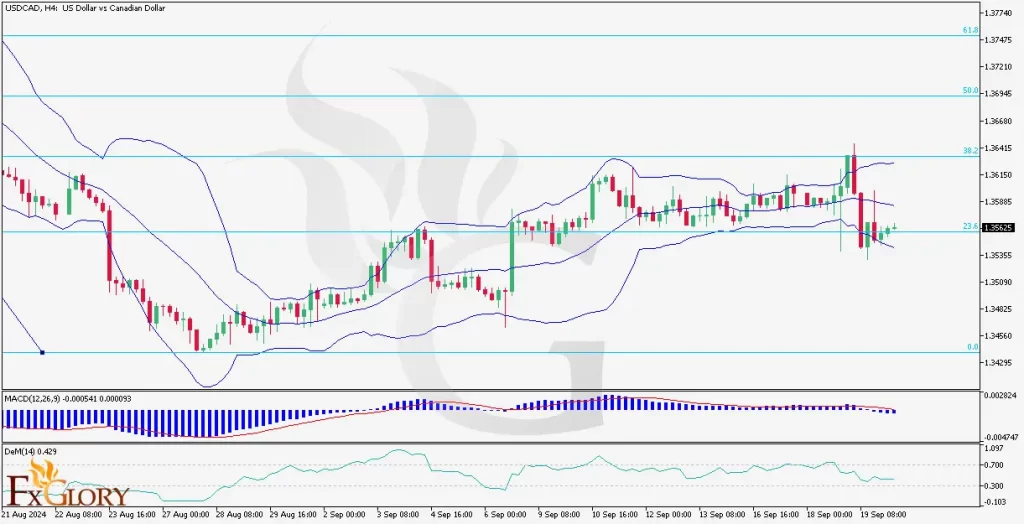
In the H4 timeframe, USDCAD has been trading in a range between 1.3500 and 1.3650 over the past few sessions, indicating consolidation after a bullish recovery. The price attempted to break out above 1.3650 but failed, pulling back toward the 23.6% Fibonacci retracement level. The recent candles suggest indecision as the price hovers near the 1.3565 level. This area has acted as a key pivot zone over the past few sessions, reflecting the current battle between bulls and bears.


Key Technical Indicators:
Bollinger Bands:
The Bollinger Bands on the USD/CAD H4 chart have widened, signaling increased volatility. The price has moved toward the lower band after touching the upper band near 1.3650, indicating a potential downward pressure. However, the price remains within the bands, suggesting the market is not yet oversold. Traders should watch for a breakout of the bands to signal the next directional move.
MACD (Moving Average Convergence Divergence): The MACD indicator shows a weakening bullish momentum, with the MACD line crossing below the signal line and the histogram in negative territory. This bearish crossover signals a possible continuation of the downside momentum unless the MACD can reverse and move back above the signal line. However, the low distance between the lines suggests the trend could reverse if fundamentals support USD strength.
DeMarker (DeM 14): The DeMarker (DeM) indicator sits at 0.429, indicating potential oversold conditions. This suggests that there might be some buying interest soon if the indicator starts to rise. However, for now, the DeM signals that the downside pressure could continue in the near term unless a reversal occurs.


Support and Resistance:
Support:
Immediate support for USDCAD is at 1.3565, aligned with the 23.6% Fibonacci retracement level and the recent price pivot. If the pair breaks below this, the next key support is at 1.3500, a psychological level that has historically acted as a strong barrier.
Resistance: Immediate resistance is found at 1.3640, which coincides with the 38.2% Fibonacci retracement level and marks the upper boundary of recent price action. A breakout above this level could push the pair toward 1.3695, the 50% retracement level, where further resistance may be encountered.


Conclusion and Consideration:
The USD-CAD pair is currently in a consolidation phase after failing to break above the 1.3640 resistance level. With technical indicators pointing toward slight bearish momentum and upcoming key fundamental events, the pair could face heightened volatility. Traders should closely monitor the speeches from the Federal Reserve and Bank of Canada governors, as these could provide clues on future interest rate decisions and drive price action. A break above 1.3640 would confirm a bullish breakout, while a move below 1.3560 could see the pair targeting 1.3500.


Disclaimer: The USD CAD analysis provided is for informational purposes only and does not constitute investment advice. Trading in the foreign exchange market involves significant risk, and it is essential for traders to conduct their research and stay updated with market conditions before making any trading decisions.


FXGlory
09.20.2024
 
GBPUSD H4 Technical and Fundamental Analysis for 09.23.2024


Time Zone: GMT +3
Time Frame: 4 Hours (H4)


Fundamental Analysis:
The GBP/USD news analysis today shows that it continues to experience volatility amid global economic uncertainties. Recent PMI data releases from the UK show manufacturing sector contraction, as indicated by S&P Global’s latest surveys, with figures below 50, signaling economic slowdown. This data puts pressure on the British Pound, particularly as concerns about the UK's economic resilience persist. Meanwhile, for the USD, market participants are keenly focused on the speeches from Federal Reserve officials, including Raphael Bostic and Austan Goolsbee, who are expected to provide insights into future monetary policy and interest rate adjustments. With key economic indicators such as inflation and PMI set to influence the pair’s forecast today, traders are advised to monitor the upcoming GBP/USD fundamental releases closely for any signs of economic recovery or further contraction in both the UK and the US.


Price Action:
The GBP USD H4 chart reveals a clear upward channel for the pair also known as the “Cable,” with its price action making higher highs and higher lows. The pair is currently approaching key resistance levels near 1.3290 and 1.3326, following a steady uptrend since early September. The pair’s candlesticks reflect strong buying interest, as its bullish market sentiment drives the price upward. However, it is crucial to watch for potential reversals if the price fails to break through the established resistance.


Key Technical Indicators:
Ichimoku Cloud:
The price is trading above the Ichimoku cloud, indicating a strong bullish trend. The cloud is thin, suggesting limited resistance ahead, but traders should remain cautious if the price dips towards the cloud for potential reversals.
RSI (Relative Strength Index): The RSI is hovering around 67.67, indicating that the pair is nearing overbought territory. This suggests the possibility of a pullback or consolidation before any further upward moves.
Stochastic Oscillator: The Stochastic is also in the overbought region at 75.25, reinforcing the likelihood of a short-term correction as the market approaches resistance levels.


Support and Resistance:
Support Levels:
Immediate support can be found at 1.3261, which aligns with the lower boundary of the upward channel. A break below this level could lead to further downside, with the next support around 1.3180.
Resistance Levels: The pair faces key resistance at 1.3290, followed by a stronger resistance level at 1.3326. A breakout above these levels could propel the pair towards higher highs in the coming sessions.


Conclusion and Consideration:
he GBP/USD technical outlook today is exhibiting strong bullish momentum on the pair’s H4 chart, supported by favorable technical indicators. However, the RSI and Stochastic suggest the pair is nearing overbought conditions, which could result in a brief correction or consolidation around key resistance levels. The GBPUSD fundamental factors, such as the upcoming PMI data for both the UK and US, along with Federal Reserve speeches, will play a critical role in determining the pair's next direction. Traders are advised to exercise caution, especially with the Cable’s volatility surrounding key economic releases. Implementing solid risk management strategies, such as setting stop-loss orders near support levels, will help mitigate risk in this volatile trading environment.


Disclaimer: The provided analysis is for informational purposes only and does not constitute investment advice. Traders should conduct their own research and analysis before making any trading decisions.


FXGlory
09.23.2024
 
AUDUSD H4 Technical and Fundamental Analysis for 09.24.2024


Time Zone: GMT +3
Time Frame: 4 Hours (H4)


Fundamental Analysis:
The AUD/USD pair is currently influenced by critical economic events. Earlier today, the Reserve Bank of Australia (RBA) maintained its cash rate at 4.35%, which was anticipated by the market, accompanied by the RBA Rate Statement and subsequent Press Conference. These factors are crucial in shaping the Australian dollar's direction against United States’ Dollar. The RBA’s stance was seen as relatively neutral, keeping future rate hikes uncertain. Meanwhile, on the USD side, significant events like the upcoming FOMC member Bowman’s speech and data releases, such as the S&P/CS Composite-20 HPI y/y (5.9%, below the expected 6.5%) and the CB Consumer Confidence report, are likely to weigh on the US dollar’s performance. With the U.S. data releases showing mixed results, traders are closely monitoring the market for any clues on future Fed policy moves.


Price Action:
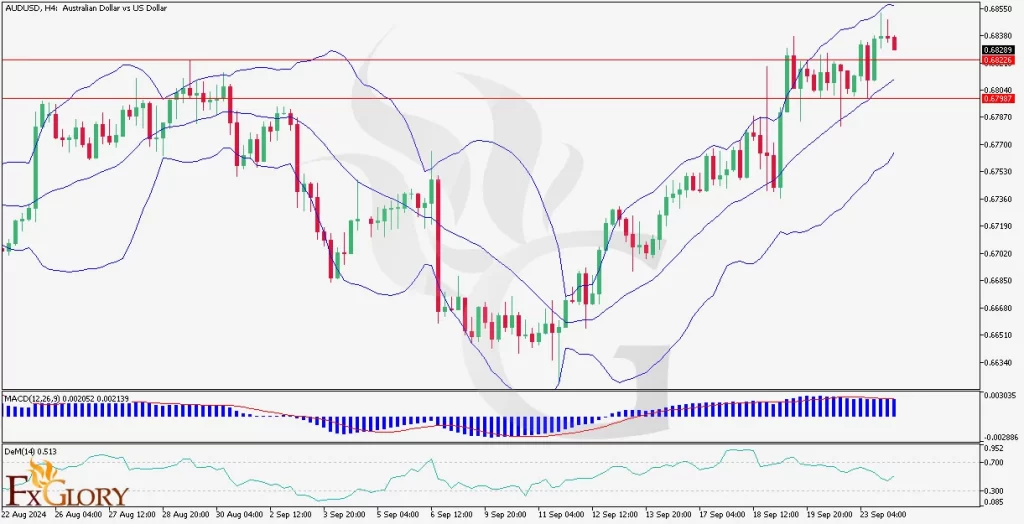
The AUD/USD H4 chart today shows a correction following a bullish rally. The price has now moved lower, testing a key support zone, indicating a consolidation phase. The Bollinger Bands show a sharp decline in volatility, with the price touching the lower band, suggesting the potential for a short-term bounce. However, the pair remains under pressure as both fundamental and technical factors point to a cautious sentiment. If AUD/USD breaks below current support, further downside may be expected, while holding above could see the pair attempt a recovery.


Key Technical Indicators:
Bollinger Bands:
The price is currently hugging the lower Bollinger Band, indicating a possible oversold condition in the short term. A contraction in the bands suggests lower volatility, signaling that a breakout might be imminent.
MACD (Moving Average Convergence Divergence): The MACD is in bearish territory, with the MACD line below the signal line. The histogram is also below zero, supporting the bearish outlook. This indicates a potential for further downside if momentum doesn't shift soon.
DeM (DeMarker Indicator): The DeMarker indicator is currently reading at 0.334, signaling that the pair may be in an oversold condition, which could indicate a short-term bullish reversal if buyers step in at current levels.


Support and Resistance:
Support Levels:
The immediate support is at 1.35000, aligning with a key psychological level. A stronger support level is noted at 1.34610, which coincides with a previous low from earlier sessions.
Resistance Levels: The nearest resistance is at 1.35700, which aligns with the middle of the Bollinger Bands and prior consolidation. The next significant resistance is around 1.36050, which marks the upper boundary of the recent price action.


Conclusion and Consideration:
The AUD/USD technical analysis suggests a cautious outlook as the pair consolidates within the lower Bollinger Band range, signaling potential short-term downside pressure. However, oversold conditions on both the DeM and Bollinger Bands suggest a possible rebound if key support holds. Traders should monitor the MACD for confirmation of continued bearish momentum or potential reversal on AUDUSD price chart. Additionally, economic events like the RBA Press Conference and upcoming U.S. data releases could add volatility to the pair. In this uncertain market environment, prudent risk management is advised, with close attention paid to the 1.35000 support and 1.35700 resistance levels for any breakout signals.


Disclaimer: The provided analysis is for informational purposes only and does not constitute investment advice. Traders should conduct their own research and analysis before making any trading decisions.


FXGlory
09.24.2024
 

Similar threads