USDJPY Price Action Targets Further Gains on H4 Chart
The USD/JPY forex pair, often referred to as the "Gopher," is one of the most traded currency pairs in the forex market. It reflects the exchange rate between the US dollar (USD) and the Japanese yen (JPY), influenced by economic data from both economies and central bank policies. Today, the focus is on the release of the US Treasury International Capital (TIC) report, building permits data, housing starts, and a speech by Federal Reserve Governor Christopher Waller. A higher-than-expected TIC reading or hawkish tones from Waller may strengthen the USD, pushing USD JPY price higher. On the Japanese side, attention remains on the Core CPI, as inflation figures could impact Bank of Japan's future policy stance. If the US data shows strength, USD/JPY could gain momentum, continuing its upward trajectory.
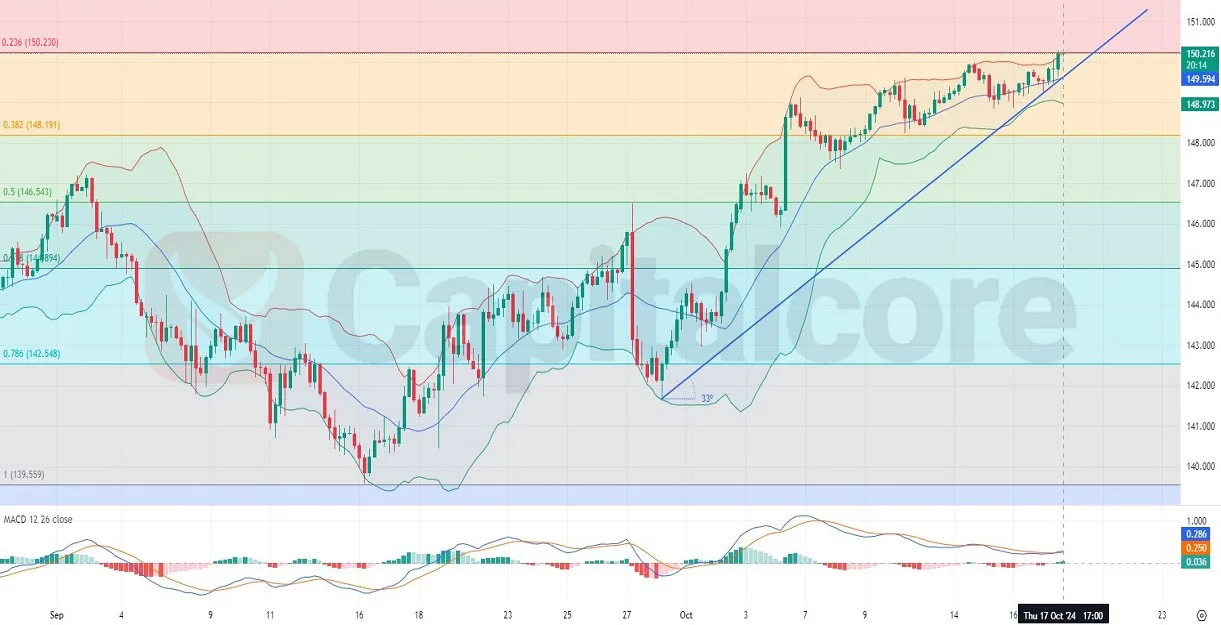
Chart Notes:
• Chart time-zone is UTC (+03:00)
• Candles’ time-frame is 4h.
Analyzing the USDJPY H4 chart, we observe a bullish trend with the price trading near the 0.236 Fibonacci retracement level at 150.216. The ascending trend line has a 33-degree angle, indicating strong upward momentum. The Bollinger Bands show the price maintaining an upward direction, with the recent candles pushing against the upper band, signaling bullish pressure. The MACD also supports the bullish trend, as both the MACD line and histogram are above the signal line, though further observation is needed for any potential divergence. The price action suggests that the USDJPY might aim for higher levels, but traders should watch for potential resistance and overbought conditions near the upper band.
DISCLAIMER: Please note that the above analysis is not an investment suggestion by “Capitalcore LLC”. This post has been published only for educational purposes.
Capitalcore
The USD/JPY forex pair, often referred to as the "Gopher," is one of the most traded currency pairs in the forex market. It reflects the exchange rate between the US dollar (USD) and the Japanese yen (JPY), influenced by economic data from both economies and central bank policies. Today, the focus is on the release of the US Treasury International Capital (TIC) report, building permits data, housing starts, and a speech by Federal Reserve Governor Christopher Waller. A higher-than-expected TIC reading or hawkish tones from Waller may strengthen the USD, pushing USD JPY price higher. On the Japanese side, attention remains on the Core CPI, as inflation figures could impact Bank of Japan's future policy stance. If the US data shows strength, USD/JPY could gain momentum, continuing its upward trajectory.
Chart Notes:
• Chart time-zone is UTC (+03:00)
• Candles’ time-frame is 4h.
Analyzing the USDJPY H4 chart, we observe a bullish trend with the price trading near the 0.236 Fibonacci retracement level at 150.216. The ascending trend line has a 33-degree angle, indicating strong upward momentum. The Bollinger Bands show the price maintaining an upward direction, with the recent candles pushing against the upper band, signaling bullish pressure. The MACD also supports the bullish trend, as both the MACD line and histogram are above the signal line, though further observation is needed for any potential divergence. The price action suggests that the USDJPY might aim for higher levels, but traders should watch for potential resistance and overbought conditions near the upper band.
DISCLAIMER: Please note that the above analysis is not an investment suggestion by “Capitalcore LLC”. This post has been published only for educational purposes.
Capitalcore