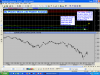
If 2572 & 2512 not broken on EoD basis then 3400 the 50 % can be envisaged.
There would be few Price hurdels on the way (mentioned in Today morning's chart).
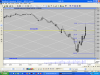
Nifty Fut Monthly ,layed on Gann Grid in an Inverted Scale.
Do you feel the last Black candel is going to go up or down,if down then on this inverted scale it actually means Up.
The upside if any then the 1st hurdel is also denoted in the chart.
dada,,, as a novice pls explian me ,,, whats use in doing so,, invertetd scale,,, we can smply study with the normla scale....may be because of gann grid lines
3406 to 3397 is the next Tgt.
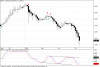
Those who are interested in EW analysis:=
The ongone 4th Wave of 5 down is expected of a zig zag correction,so this leg of the wave is to last for few weeks with Up & Down moves.
This Index wave pattern may not match with most of the stock,few may have completed their 5 Downs so challenge is to identify them early.For those which matches with Index we still have time to enter after 1-2 months,hence Long entry in those stocks NOW ,we may have to see further pain of Price correction.
Leaving aside EWave analysis, the 65 degree angle (almost vertical) Price rise smells of 'Bear Rally' & extreme over sold zone bounce,so we have to watch the retracement & volume when it comes down.
A few days range bound or slow 'Price-Time' correction may give us more confidence in our 2nd Entry of Longs.
As a Zig Zag correction is what i feel on the cards,(in my earlier post) in this 4th Wave Leg of the 5 Down,hence the probable Tgt is 2778 (Logic explained in earlier chart).
My attempt for trying to analyse Price's Wave Pattern:=