sorry Asish da,
the following is what I learned in the thread, "Trading Under candle light". the reverse is true of a bullish engulfing.
"BEARISH ENGULFING PATTERN
It is a chart pattern that consists of a small white candlestick with short shadows or tails followed by a large black candlestick that eclipses or "engulfs" the small white one.
Investopedia Says:
As implied by its name, a bearish engulfing pattern may provide an indication of a future bearish trend. This type of pattern usually accompanies an uptrend in a security, possibly signalling a peak or slowdown in its advancement. However, whenever a trader analyzes any candlestick pattern, it's important for him or her, before making any decisions, to consider the prices of the days that precede and follow the formation of the pattern.
The pattern consists of two Candlesticks:
Smaller Bullish Candle (Day 1)
Larger Bearish Candle (Day 2)
Generally, the bullish candle real body of Day 1 is contained within the real body of the bearish candle of Day 2.
The market gaps up (bullish sign) on Day 2; but, the bulls do not push very far higher before bears take over and push prices further down, not only filling in the gap down from the morning's open but also pushing prices below the previous day's open.
With the Bullish Engulfing Pattern, there is an incredible change of sentiment from the bullish gap up at the open, to the large bearish real body candle that closed at the lows of the day. Bears have successfully overtaken bulls for the day and possibly for the next few periods."
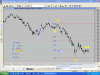
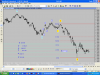
in view of the above I beg to differ with you. the candles you have shown are not bearish engulfing candles.
correct me if I am wrong.


 75.3 KB Views: 67