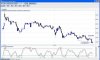
How to trade with an oscillator

Avad, I have received the files and am uploading the file "Law of Charts". It doesn't seem to have anything to do with oscillator hooks. But it is a good tutorial on 1-2-3 formations and Ross Hooks. Thanks for the effort.
 

murthyavr

Well-Known Member
broke my rules and paid for it...did a trade loss of -12 pts.

wll have to adhere to my rules.:)
Dear Avad,

This thread on Oscillators has been started by Smart_Trade, one of the reputed
persons on this thread. His ideas are shared by him in this thread and we all
share his knowledge, posting relevant queries on the topic.

Your enthusiasm to learn things is appreciated, but we should not be diluting the
seriousness of the thread of somebodyelse. Added to that, with so many off-topic
posts, any new-comer to this thread will miss the important posts.

I suggest you start your own thread - with the trade rules specified by you.
And you can also post the daily trades also in that thread. Whereas it acts
as a review for yourself, you may also receive some good suggestions from
other learned members.

Let's all strive to keep this thread clean and focussed.

Thanks..
 
I was away from TJ for a quite some time. However just last week i was back and very glad to see this wonderful thread by ST. I read the whole thread and now trying to apply the concept to live trading. Of course with very small trade size :)

I am attaching ICICI bank chart for today till 2 pm. I have marked a divergence. Also a long entry. The trade went on to hit SL. I do understand that there will be few cases where the trade will go in other directions. I only want to know whether i analyzed the case properly..whether i was right in taking this trade?

Thanks ST for this amazing thread.

Suraj
 

Attachments

Last edited:

DanPickUp

Well-Known Member
Dan,

The international markets seem to be obliging all the technicals perfectly well!

See this EUR/USD 5 min. chart of today..


There was no need to pull out any other weapon from the technical analysis
skills - just the TRENDLINE was doing the whole job .. !

See the brilliant confirmation of Stoch Divergence at two places marked A and
B in the chart. The prices have gone above MA-21 at these two places, gone
beyond the previous lows - thus causing doubts if the downtrend was about
to end.

In both these places, the negative divergence (marked on the charts) indicated
that the the downtrend has still some more distance to travel and the prices have gone
down subsequently as indicated by the divergence!
Hi murthyavr

Thanks for your comments.

Checked your post on my chart. Changed the Stoch to 8.4.3 and then I got this picture:

http://i44.tinypic.com/1194ihc.png

Such pictures depend also a bit to the settings we use for Stoch. Any way, I learn to give some attention to divergences.

Thanks

DanPickUp
 

rangarajan

Well-Known Member
i am posting todays 5min chart of Prakashcon,stoch8,3,4.
Stock stayed in O/B zone Twice for more than 5 bars & every time made new high on retracement .
In fact on retracement,even when%K was only around 40,it made new High.
It also never filled a Gap down side around 242.
What i am not sure is,whether there was a negative divergence bet 12.20 to 13.50 when Stoch was from 25 to 19 while stock never fell.


murthyavr

Well-Known Member
What i am not sure is,whether there was a negative divergence bet 12.20 to 13.50 when Stoch was from 25 to 19 while stock never fell.

Dear Rangarajan,

When you say 12:20 and 13:50, I hope you are referring to the lows of
the stoch and the lows of the price. Right?

Yes.. there is divergence.

It is not negative divergence. It's positive divergence (hidden). After the
positve divergence, prices are likely to go up.. And the price has gone up
from approxmiately 260 to 275 (approx.)
 
Hello Dan, I see the following positive divergence in your chart (marked in red).


The divergence that you have marked, price making lower highs and stochs making higher highs, maybe it qualifies for reverse bearish divergence as explained by Kavima recently somewhere in his thread (the dominant trend shall prevail, or something like that).

As ST explained, for a bullish divergence, you compare the bottoms (of price and stochs) and for a bearish divergence you compare the tops.

Just my view, not an expert.
 

Similar threads