^I love how you explained this. It's exactly on my line of thinking.
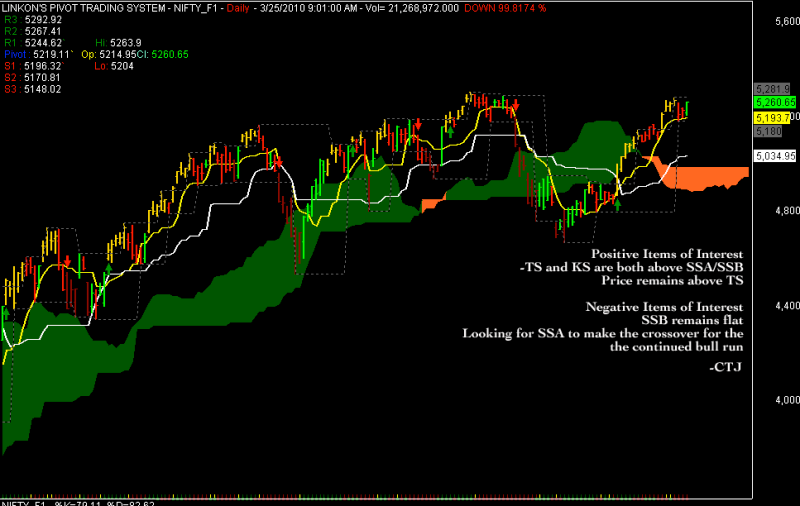
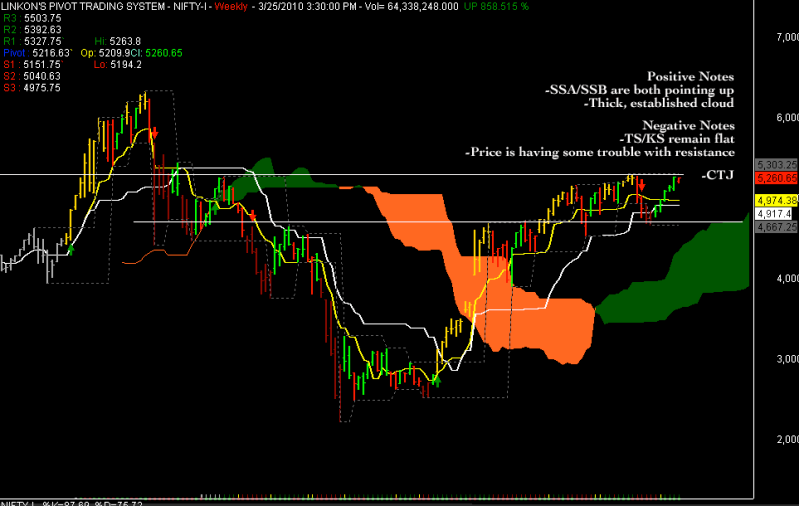
Thank you Linkon for the charts and explanations. I really like what you doing and I think we are pretty much on the same page. I see what you are saying and I completely agree. We have to look at TS, KS, SSA, and SSB as simply moving averages. That is to say price wants to move towards the higher of the averages (KS and SSB).
And each one of the moving averages also act as support and resistance. The more layers of resistance (TS, KS, SSA, SSB) price breaks, the more prices will move up and confirm the bullish trend. NOTE - I say UP/BULLSIH because I don't short prices as I mostly trade US Stocks. Options and Puts are a different story but in swing trading stocks, I never short.
In order to understand the depth of Ichimoku to the fullest, I had to take it to the extreme. I was sort of like a rabid dog trying to find food in every corner until one day I found a giant dumpster with all the food I will ever need. :rofl:
You see, when you truly love something, you emerse yourself in it in every which way. I know you understand this completely. I put myself in the charts for so long that I felt like I was seeing in 3-D. Now that I fully see the many layers of ichimoku, I can take a step back and bring it back to the basics. I don't need to be as complex now. It's very simple. We are merely looking at moving averages (4 of them to be exact) and each one of their values when looked at as a whole paints a very clear picture of future price movement.
I'm trying to catch prices as they swing from their downturn into their upturn.
Very simple concept, really. The magic for me happens when price is in between TS and KS. This is the anticipation of prices moving from their downtrend into an uptrend whether this be below the cloud or above. It's all the same when you are swing trading. If you are trend trading then yes, you will of course want your magic signals to happen in (neutral) or above (strong buy) the cloud.
If some of the nifty traders would like to post their charts I would love to analyze them and explain what I see.


