Ichimoku Kinko Hyo trading system...!

Status
Not open for further replies.

vinst

Well-Known Member
Hi Camel,

thanks for encouragement. I am posting sensex EOD chart with stochastics 9,3,3 in blue (scale on right side). Ignore the vertical majenta and brown lines. I noticed that sensex closed below the yellow line for one day. what does your analysis say about sensex ?


regards,
vin
 
Last edited:

CamelToeJoe

Well-Known Member
well it's looking great. Strong bull right but still below resistance. It's okay for price to close below TS as we can't expect price to always hold above the 9 day average on any bull run. However, I usually use TS as my stop/profit taking at the very end of a run when TRIX fast line has crossed back below TRIX slow line. IMO, TRIX works very well in conjunction with Ichimoku as it keeps us in trends without shaking us out early of our trade.

In the above chart, stochastics looks to be making a turn for the positive. If this holds, sensex should be able to break the current resistance of 17650.
 

vinst

Well-Known Member
well it's looking great. Strong bull right but still below resistance. It's okay for price to close below TS as we can't expect price to always hold above the 9 day average on any bull run. However, I usually use TS as my stop/profit taking at the very end of a run when TRIX fast line has crossed back below TRIX slow line. IMO, TRIX works very well in conjunction with Ichimoku as it keeps us in trends without shaking us out early of our trade.

In the above chart, stochastics looks to be making a turn for the positive. If this holds, sensex should be able to break the current resistance of 17650.
Camel,
thanks for your analysis for sensex. On trix, which parameters do you use ?

regards,
vin
 

CamelToeJoe

Well-Known Member
BSE and Nifty have similar bull charts. Really no updates. Look to stochastics and TRIX for overbought signals (short term movement) and trix (longer term movement) as additional profit taking opportunities with Ichimoku.

Reference Chart
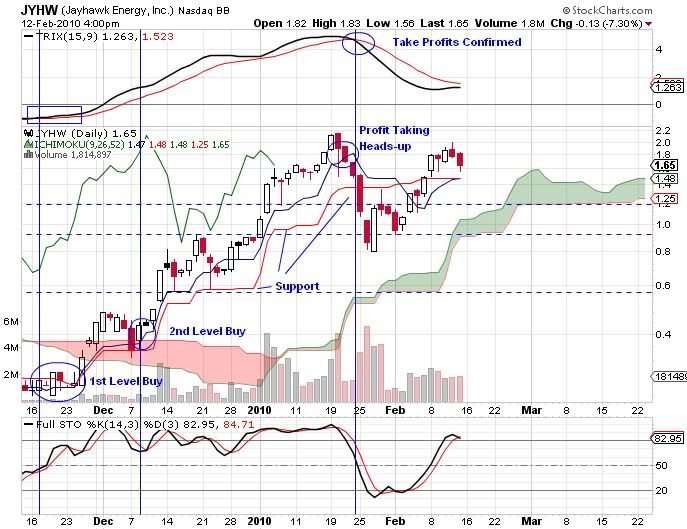
1st level buys occur when Price is below KS but just crossing above TS. If TS and KS are close enough where price may cross both then even better. This tells us that the 9 day TS formula and 26 day KS formula have almost the same price result. If price breaks this, then we are now looking to TS/KS as support and volatility, which is obviously low at this point. Price breaking SSB and then grabbing support on SSB would possibly be a chance for a 2nd level buy if you desire. KS will act as our main support on any bull run. It's okay for price to fall below TS at times as we can't expect price to always maintain above it's 9 day TS formula on any given run. Look to stochastics and TRIX for additional sell/profit taking indications.


vinst

Well-Known Member
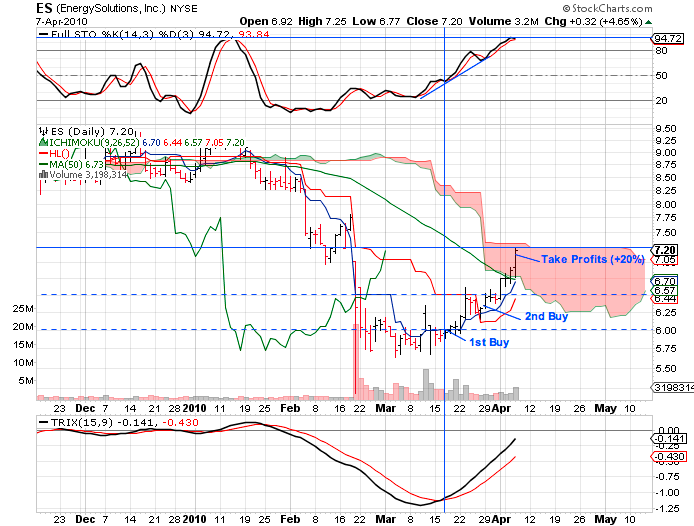
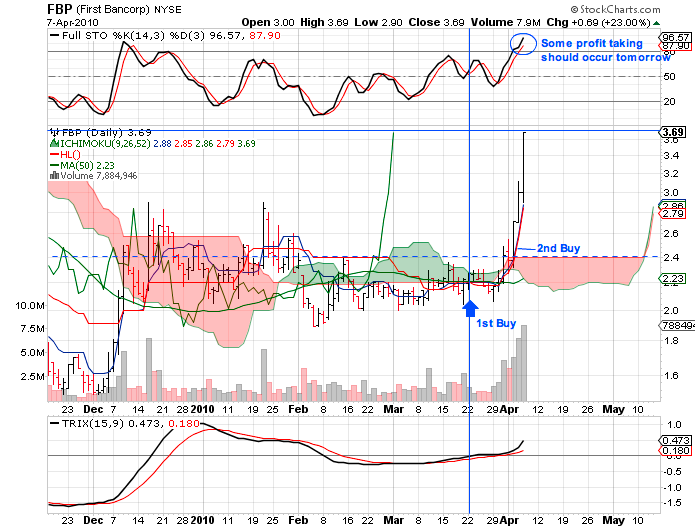
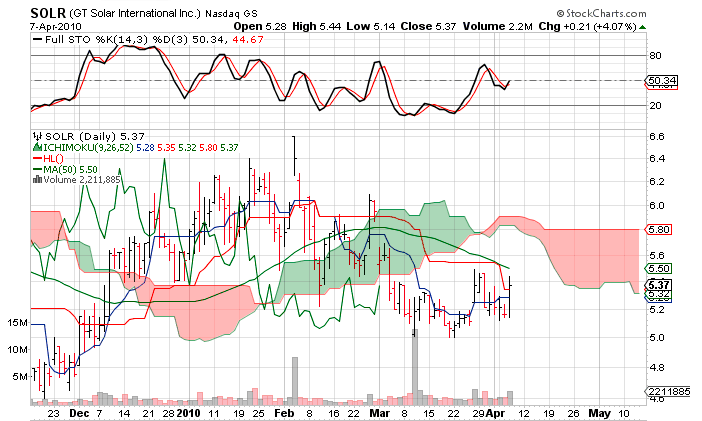
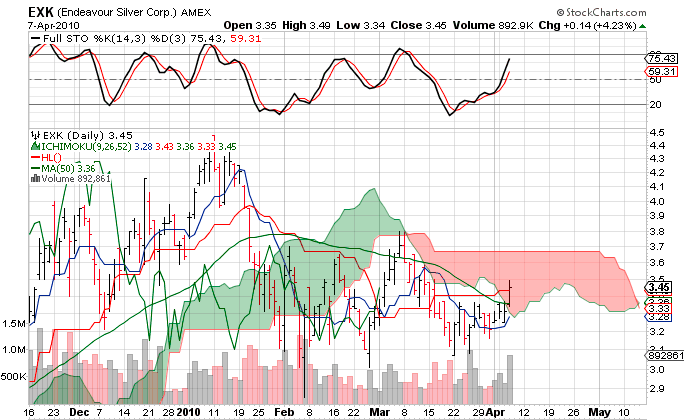
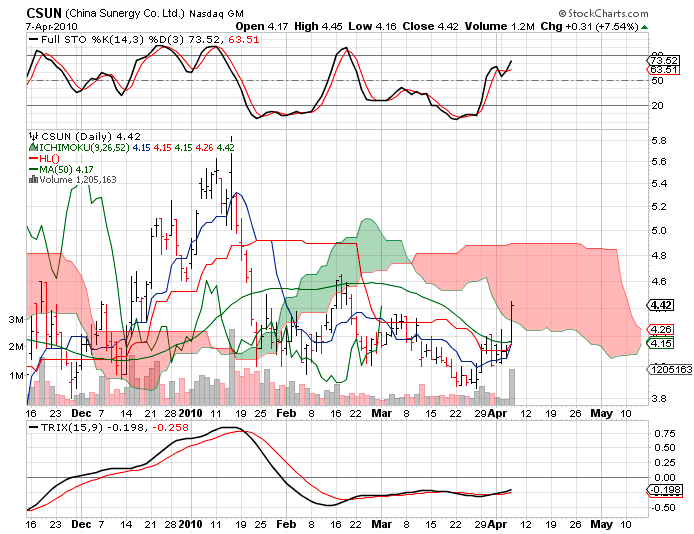
These were my last two US stock trades (swing) using Ichimoku


+65% on this one :)
Camel,
Both stocks were bought when thy were in 'sort' of sideways price movement. One of them bought when just a close abv shortest line is obtained. This is confusing me as it has been said that one single close above shortest line should not matter much. Can you please clarify?

vin
 
Status
Not open for further replies.

Similar threads