Ichimoku Kinko Hyo trading system...!

Status
Not open for further replies.

AW10

Well-Known Member
vinst, with whatever limited knowledge I have of Ichi, I think, the chart will always throw conflicting signals. What u have mentioned is not rocket science (plz don't get me wrong), they are bold in clear on the chart, price below x,and y and z, line y cross z, indicator crossing etc etc.

Important question is how to trade it.. What is our system to trade ? and interpret this chart wrt the system rule..
Say, if some is just following TS-KS cross over system.. then the person would have been short from bar # 3256 or so.. and if crossover happens again, now, then would be closing the position.
If someone wants to go and buy depeding on this ts-ks system, the clould is just above the entry level, which indicates lower probablity of success..

I think, the thread from Ankit had give some possible systems around 5 ichi lines.. In my view, that is more important for a trader.

In my simplistic style of trading, Any buysignal below cloud is not for me, so even if there are signs of it, i will stay away from it..
But if I get any new sellsignal then I will initiate short, or add to my previous shorts.
Cause cloud is supporting me with Short trades.

Will be waiting for others view on this.
Happy Trading
 

linkon7

Well-Known Member
VINST,
Thanks for posting the sensex charts...
on NIFTY EOD,

We have one trendline that was broken on CS and then prices came back below it after 2 days... We now have to wait for price to climb up above that line (i.e. at 5040) to abort the bearishness and it has to close above 5172 to qualify to be bearish...

TS has crossed KS from below... that normally is assumed to be a signal for trend change. what this signifies is that the mid point of the last 9 day's high and low is roughly the same as the last 26 day's midpoint. Thats all the info there is on the chart. fact that price is below 50% retracement of both 26 days and 9 day's means that we still cant go long on this index.

Regarding the oscilators, keep in mind that oscilators derive its value from the price. on thursday and friday we had 2 bars that had gapped up and then on monday bars gapped down. Any oscilators measure the performance of the last n-number of bars to give u the feel of the general direction. but this brings in a lag in its response time. think of it as a progressive average of the scores of 11 bars. Those 2 gap up bars have cancelled the effect of the lower 2 bars making the indicator look bullish. But in effect we are below the cloud and below both KS and TS. This is when we have to ignore the oscilators and confirm the trend on lower time frames...
 

linkon7

Well-Known Member


same chart on hourly gave u a clearer picture.... there was distinct divergence on MACD and rsi... Now its just a matter of breaking todays low and we will be below the cloud...on hourly tf...

notice the price action... TS has crossed KS from above and gives us 5036 as hrly tgt above which longs can be attempted... this corresponds to thee 5040 mark mentioned earlier...
 

CamelToeJoe

Well-Known Member
Sensex chart.

One thing we know, we are in a bear trend, however large or small that trend is.

So personally, I would play with the bears. We do have a TS/KS cross but this is very weak with both CS and SSA/SSB cross still being bear.

We should stick to the signals. This TS/KS bull cross tells me to take some profits from my short. Looking at ichi as a whole, it does not tell me to sell my entire position or switch trades to the bullish side yet. We'll continue to watch the signals for a possible reload to the downside or if the signals change, we'll change to the bullish side.

I only have Sensex on the daily chart which doesn't help give me the full picture. I like to trade the hourly while looking at 5 and 1minute for timing.

I believe if you stick to ichi signals as a whole instead of just looking at 1 or 2 of them you will make more profitable trades than losing ones. For me, this is a fact but I've spent potentially thousands of hours studying Ichi charts only to come back to the beginning - Look at Ichimoku as a whole and follow the signals strictly. TS/KS cross - check. CS trendline - check. SSA/SSB cloud (bear or bull) check.

Starting with the daily chart, your positions remain bear below the cloud. Your positions remain bull above the cloud. You can still play bear above the cloud on pull backs if you want to scalp but these are always risky plays and not necessarily the best for beginning to intermediate ichimoku traders.

We may have a TS/KS bull cross, but we should consider CS trendline and it's relationship to price action. A first level buy can occur when TS/KS bull cross happens with CS above it's current trendline. A second level buy would occur when CS cross above price action. If resistance proves to be too strong here, we must take profits even though they might not be much (it's still profit!) A third level buy when we add more to our position is when SSA crosses above SSB. From this point on, I hold and ride the bull train up. After my initial position from the daily, I will usually look to trade the hourly chart for potential profit taking and reloads. I look to the 1 minute and 5 minute to time it properly.
 
Last edited:

CamelToeJoe

Well-Known Member
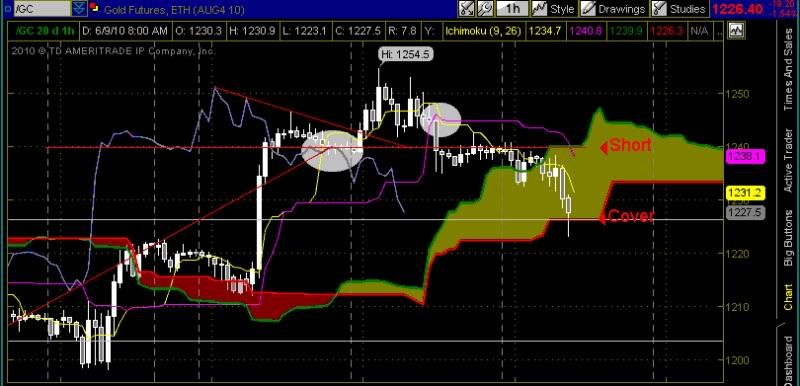
Gold Futures Trade

As mentioned above, I look for my first signal. This time it was the TS/KS bear cross. So...I'm looking at short.
Then I look to CS and draw my trendlines and simply watched for the break. Paid attention to price action in the morning
and hopped in for the win. I covered the short just above TS on the daily.


CamelToeJoe

Well-Known Member
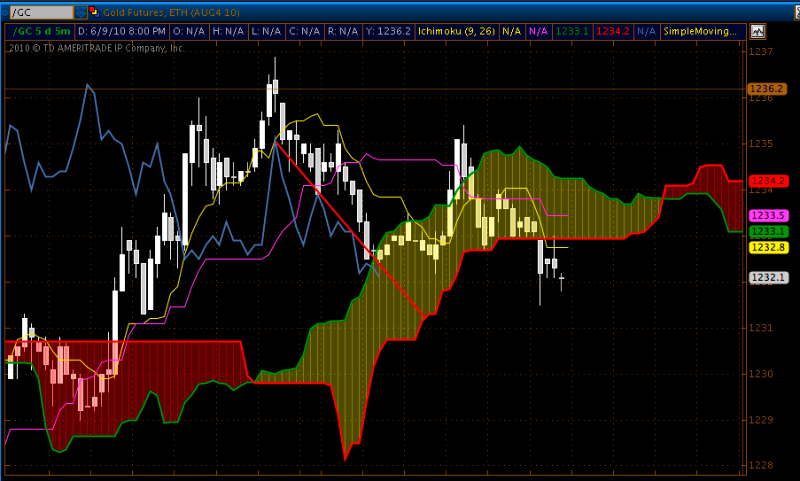
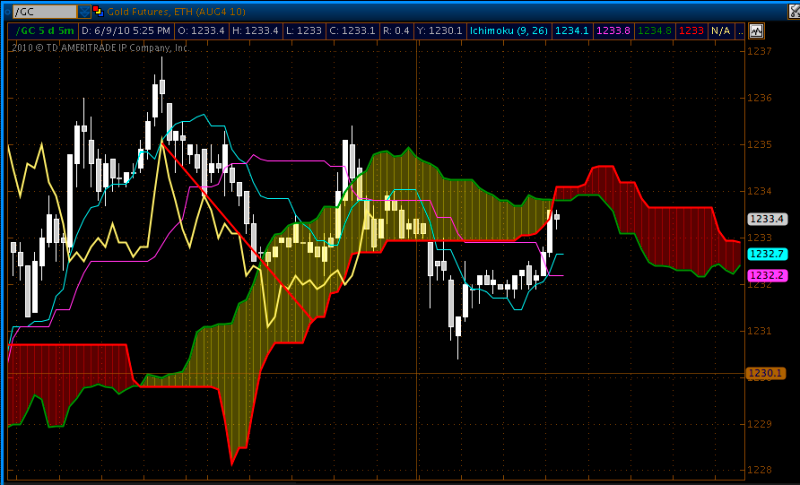
Gold Futures

Looking at another short here if price stays below the cloud on the 5 minute. So short below the cloud when TS/KS exit and CS remains below the trendline.
CS below the cloud would be a nail in the coffin.

Long if the CS trendline is broken. I'll also be looking for a bullish TS/KS cross with price above the cloud for a long position.

Personally, I feel more comfortable with the risk/reward of the short.


CamelToeJoe

Well-Known Member
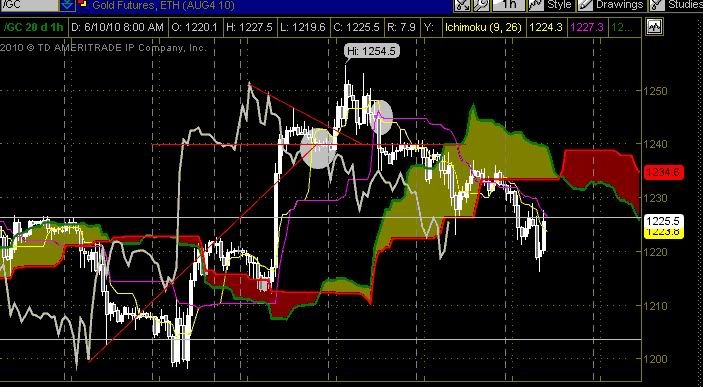
I was looking for the Gold short and it happened overnight. I was still able to scalp some this morning though.

Gold Futures hourly chart. Short 1224, Cover at 1220 (2 lots)


I was sitting at the computer last night telling Dani (Girlfriend) that Gold is going down tonight (it was at 1232). I wanted to short it before I went to bed to wake up to some big profits. The signals were there though and I wasn't that surprised when I woke up to see Gold at 1220.
 
Last edited:

CamelToeJoe

Well-Known Member
Sensex - Considered a weak bull below the cloud. I would still wait to consider any daily bull plays as we are right under cloud resistance. I think we'll get a better idea of where it's headed towards the end of June. I'd be looking at the hourly and 5 minute for intraday plays which I hope you guys have been able to catch the bull intradays and play them accordingly and maybe get some insight into Sensex' direction for next week.
 
Status
Not open for further replies.

Similar threads