Ichimoku Kinko Hyo trading system...!

Status
Not open for further replies.

CamelToeJoe

Well-Known Member
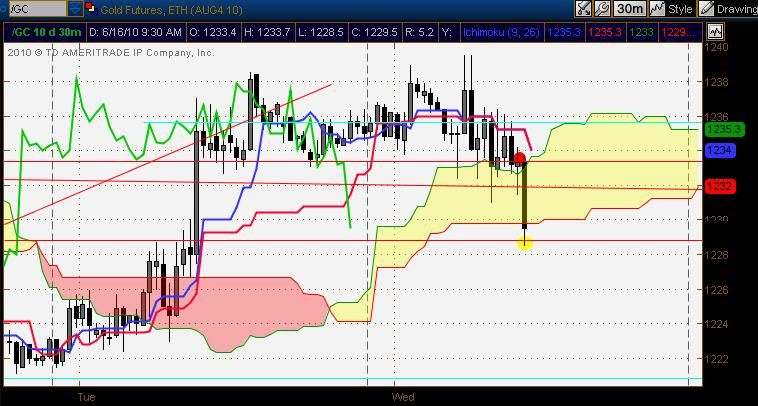
4.3 point Gold Futures short


30 minute - Cloud break with TS/KS pointing down

Note - Blue price line is TS on the daily.

5 short signals total
1 - CS breaking it's trendline
2 - CS falling below price action
3 - Price falling below TS on the daily
4 - Price falling below 30 minute TS/KS which were together and pointing down
5 - Price break in the cloud


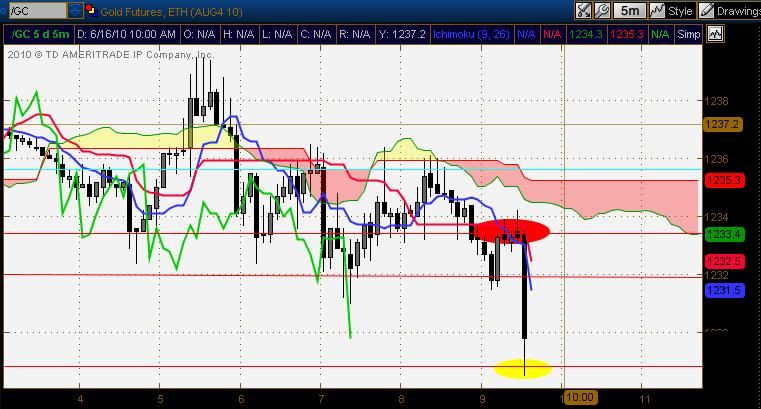
5 minute - Waited for the bear TS/KS cross below the cloud for the play.
I got out when I saw it bounce off of daily CS support (highlighted in yellow)
 

vinst

Well-Known Member
Sensex EOD chart with candle of 17-June still in the making.
Price has gone above cloud where cloud was thin.
BUT cloud is still bearish in future.
Acc-dist made a new peak.
overall continuing to look bullish.


regards
vin
 

linkon7

Well-Known Member
Hi,

Sensex EOD, cloud turned bullish in future.
None of ichimoku lines are bearish.


regards
vin
this is the time when you should be cutting ur long positions and stay light... watch higher tf and observe the turning points on CS...

Stop focusing on the cloud's color. if price has settled below the cloud... green color cloud above the price will act as the resistance zone.

Keep in mind the distance price is from the KS represents 50% retracement of the last 26 days and if price has moved too high, then its bound to come down or will pause till KS comes near...

another idea is to watch KS on shofter tf like hourly or 30 min and decide on potential cut off point...
 

vinst

Well-Known Member
Hi,
Linkon's worning about lightening long positions on sensex was timely since sensex could not rise after he made the post! His logic was distance between KS and price.
that distance is still fairly large and so still long positions can't be added.
However, Ichimoku lines are still bullish. CS has been making flag-type movement and needs to breakout, only then we should add to long.
eMACD (proxy of TRIX) had flattened at top.


regards
vin
 

CamelToeJoe

Well-Known Member
Here's a tip - Draw price levels on the daily (if needed, use 4hr and 1hr as well) from KS, TS, and flat top/bottom clouds and use these as entry/exit targets on the smaller TF's.

Gold Futures Price levels.

Current price resistance 1212
Look for a long above 1214 to the top of the kumo at 1220.
Look for a short below 1214 to price support at 1208 and then on the hourly KS (1204) and finally price support 1202.
Daily kumo ssb support at 1195 noted as the thick dotted line


Status
Not open for further replies.

Similar threads