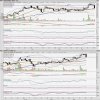
Learning to catch High Probability Breakouts

Status
Not open for further replies.

amitrandive

Well-Known Member
Entering an uptrending strong stock

Amit ji

why they were called weakness as they are near Moving average line or they are near pivot/ or pivot themselves

anil negi
Anil Ji

The person who created the chart , might have the following in mind,
1)Doji or bullish pin bars or bear bars in a strong uptrend is weakness.
2)Buy at weakness at bounce off a moving average.

So for him , weakness is a chance to get long, which is logical way to get entry in a strong uptrending stock.

This is like reversion to mean or you can also call it a pullback trade.

:D
 

amitrandive

Well-Known Member
amitrandive

Escorts – Cup and Handle Breakout move up towards previous high 240..? Its Possible..!!!

Shreeux

I think the handle is about to built and not build till yet, but even for breakout it looks very promising stock,

anil negi
Yes , Shreeux

Sure looks a promising stock.But I would wait for it to pullback and form support around 160 levels before initiating longs.The vertical upmove is bound to be followed by some profit booking.

Also , I would generally trade some other pattern than the cup and handle pattern.

As per Bulkowski, this pattern generally takes 7-65 weeks for a cup formation , which is too long to track.You can have many high probability setups in the duration of this pattern developing.

http://thepatternsite.com/cup.html

Weekly Chart of Escorts


XRAY27

Well-Known Member
Dear Amitji,

You have asked a question in day trading future thread of manish... regarding todays trade and spoting trend change..

Below are the quote/s of ST da explaining intraday in two lines

"Intraday trading can be done in following ways :

1) Take all trades in the direction of the longer timeframe. So if we are trading on 5 min chart, see what is the trend on 30 min chart...if it is down, take all short trades on 5 min chart.....but your trade entry,stops and profit taking all has to be on 5 min chart.. This is relatively easy as we are trading in one direction generally unless the trend on larger timeframe reverses during the day..

2) Trade the intraday swings without any bias....trade as the price flow moves...trade from short and long both sides....this mode is bit difficult as we need to be fast in reversing our positions and we need to understand the market action well....and very rigid on stops...."


My approach for today

1.Today morning NF opened flat and remained in the same position in that mode till 9.45AM..... over all trend as per highertime(30 min and hourly charts) are -ve to flat... not bullish

2. There after shorted around 8039 and covered at 8049..

3. Second trade was at 8033 level ..with small stoploss..
yesterday i have spoted rounding top in nifty hourly which will be activated around 8010 level and (posted yesterday)

4.MAX pain for today is 8000 level nifty spot brokern 8000 level NF brokern 8010 level ..

5 For safe trade i traded 8100PE there... got some good points....

Suggestion:

1.Put more focus on "PRICE ACTION"

2.TIME TAKEN TO notice the change of trend is much more important and quick reaction should be needed there after
 

amitrandive

Well-Known Member
Dear Amitji,

You have asked a question in day trading future thread of manish... regarding todays trade and spoting trend change..

Below are the quote/s of ST da explaining intraday in two lines

"Intraday trading can be done in following ways :

1) Take all trades in the direction of the longer timeframe. So if we are trading on 5 min chart, see what is the trend on 30 min chart...if it is down, take all short trades on 5 min chart.....but your trade entry,stops and profit taking all has to be on 5 min chart.. This is relatively easy as we are trading in one direction generally unless the trend on larger timeframe reverses during the day..

2) Trade the intraday swings without any bias....trade as the price flow moves...trade from short and long both sides....this mode is bit difficult as we need to be fast in reversing our positions and we need to understand the market action well....and very rigid on stops...."


My approach for today

1.Today morning NF opened flat and remained in the same position in that mode till 9.45AM..... over all trend as per highertime(30 min and hourly charts) are -ve to flat... not bullish

2. There after shorted around 8039 and covered at 8049..

3. Second trade was at 8033 level ..with small stoploss..
yesterday i have spoted rounding top in nifty hourly which will be activated around 8010 level and (posted yesterday)

4.MAX pain for today is 8000 level nifty spot brokern 8000 level NF brokern 8010 level ..

5 For safe trade i traded 8100PE there... got some good points....

Suggestion:

1.Put more focus on "PRICE ACTION"

2.TIME TAKEN TO notice the change of trend is much more important and quick reaction should be needed there after
XRay

Thanks for taking the time out and posting such a detailed explanation on price action !!!

:clapping::clapping::clapping:

Looking forward to receiving good guidance from you and other seniors in future too !!!
:D

Just one question , where to get daily Max Pain for Nifty ?
 
Yes , sure the entry point should always be on candle closing basis.
Many times the same breakout candle can convert into a huge bearish pin bar after it closes.

If you try and gain an early entry , you are sure to have your hands burnt.

See a good post for closing basis entry.


A good read

http://www.onestepremoved.com/free-expert-advisors/intrabar-trades/
What is your view on breakout candidates (Ashok Leyland, Firstsource Solutions) which had recently made a good breakout from earlier resistance level but in today's fall are suddenly back into the resistance zone.

Thanx
 

Attachments

amitrandive

Well-Known Member
What is your view on breakout candidates (Ashok Leyland, Firstsource Solutions) which had recently made a good breakout from earlier resistance level but in today's fall are suddenly back into the resistance zone.

Thanx
Manoj

Personally I will not trade/invest in these kinds of stocks.They have hardly shown any signs of strength till now.

Attaching the Daily and Monthly charts of Ashok Leyland and Firstsource solutions.

Daily Chart of Ashok Leyland


Monthly Chart of Ashok Leyland


Daily Chart of Firstsource Solutions


Monthly Chart of Firstsource Solutions


Just because it is a Bull Market all stocks with or without strength have just blasted off.Whether they can sustain that breakout , only time will tell.
:D

My Personal View: I would rather trade a 200 rs stock and get a 10% profit of 20rs than trade a 20 rs stock and get a 10% profit of 2 rs.
 

XRAY27

Well-Known Member
XRay

Thanks for taking the time out and posting such a detailed explanation on price action !!!

:clapping::clapping::clapping:

Looking forward to receiving good guidance from you and other seniors in future too !!!
:D

Just one question , where to get daily Max Pain for Nifty ?
Sorry for late reply.........

There is a application in Health raj section of options Please check that......
 
Last edited:
Status
Not open for further replies.

Similar threads