Some of my forecasts

Status
Not open for further replies.
Re: Dax

My weekly levels for the 11 major markets are posted at the beginning of the week.
NOW, I'll get out of here.
OK Mr pips, goodbye for now have fun ! here is my weekly request to you if you get time could you do the weekly forecast a little early like on the weekends it would be kind of you, if you get time !
 
Last edited:
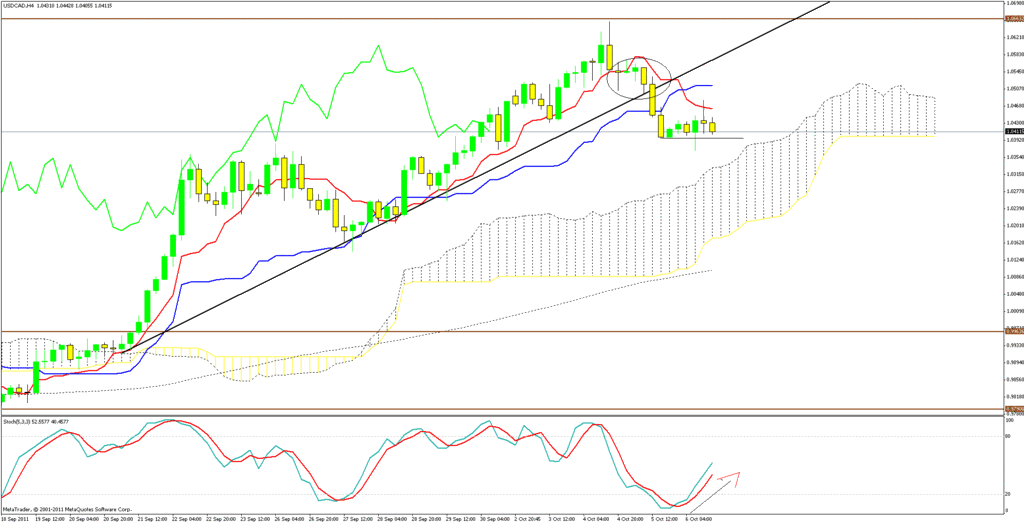
Raj, have a look for further explanation - usd/cad 4 hour chart shows the fine uptrend , Do you see the circle that is marked, It was the exit as it gives indication of a correction or a retracement it came below the h4 tenken and finallly broke the trend line and went below the kinjun. Now look at the stoch it is giving a bull divergence as the pair is moving sideways look at the future cloud in bulls, Change the time frame to daily! the daily tenken is acting as a great support which possible resumes uptrend look at the future cloud bullsih!! look at the weekly the pair has already broken the top cloud future cloud has changed to bullish! switch to monthly it is above kinjun! most favourable conditions are the bottom of the monthly cloud to be hit! these are signs for uptrend!


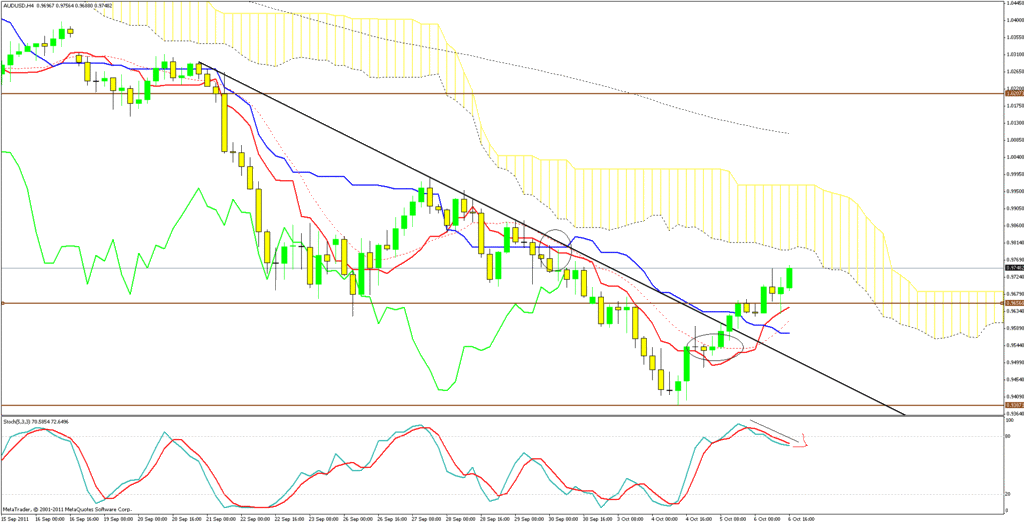
Look at this one h4 chart shows a nice bearish trend in place, Look at the first circle tenken sen crosses kinjun sen below the cloud it is a strong sell signal, now have a look at the next circle it was a jump out signal as it settled above tenken indicating a correction, finally it broke the trendline and the kinjun and a correction is in place also keep an eye on the stoch divergence ! btw I bought at the reversal at the bottom of the weekly cloud targeting for the 4 hour weekly kinjun which got hit yehhhh now I too feel like a baby in a candy store like Mr pips - LOL some days are good same days are bad, Here I would suggest you never get undisciplined trading and get into a hurry to trade ! This is a major drawdown I have done that before and Always got smooked !


Last edited:
Let me add something there. Generally speaking, it is a mistake to enter a trade on a long just under the TL and the kijun. How do you know for sure that price was going to break it. If you had a way of telling, them I stand corrected.

I got a question, because I'm curious. Your first post in the thread was #1166. 2 posts later you had the most basic of questions (Do not mistaken me here. I'm not knocking any question that someone has.)-- "which was asking me what timeframe I use. The types of questions you asked could only come from a beginner. 5 days later an exceptional knowledge has evolved.
Do you learn that quick, or am I missing something? I was also thinking, maybe it was stored knowledge from following the thread in the past, and now it's all coming together?

Look at this one h4 chart shows a nice bearish trend in place, Look at the first circle tenken sen crosses kinjun sen below the cloud it is a strong sell signal, now have a look at the next circle it was a jump out signal as it settled above tenken indicating a correction, finally it broke the trendline and the kinjun and a correction is in place also keep an eye on the stoch divergence ! btw I bought at the reversal at the bottom of the weekly cloud targeting for the 4 hour weekly kinjun which got hit yehhhh now I too feel like a baby in a candy store like Mr pips - LOL some days are good same days are bad, Here I would suggest you never get undisciplined trading and get into a hurry to trade ! This is a major drawdown I have done that before and Always got smooked !


The Monthly Kinjun is 1.35098
The most important barrier is to cross the top of the cloud in H4.
My next target would be 1.351 which is the bottom of the cloud in H4 as well as descending TL from 7th Sept 11 touch 28th Sept.

Regards
Raj
 
Hi Am I talking to a Ghost right now? if anyone is viewing now we can have some discussions?
Haha.. Sorry for not replying.. I went to sleep. I am in Singapore timezone and it has already passed 12 midnight.

I am heading to work and will get back to you on both charts in the evening.
You have put in the best charts to explain and It was a nice setup formation. I will analyze them more and get back to you. Really appreciate for putting up the charts for me.

Regards
Raj
 
Last edited:
Look at this one h4 chart shows a nice bearish trend in place, Look at the first circle tenken sen crosses kinjun sen below the cloud it is a strong sell signal, now have a look at the next circle it was a jump out signal as it settled above tenken indicating a correction, finally it broke the trendline and the kinjun and a correction is in place also keep an eye on the stoch divergence ! btw I bought at the reversal at the bottom of the weekly cloud targeting for the 4 hour weekly kinjun which got hit yehhhh now I too feel like a baby in a candy store like Mr pips - LOL some days are good same days are bad, Here I would suggest you never get undisciplined trading and get into a hurry to trade ! This is a major drawdown I have done that before and Always got smooked !


I thought that I better analyze this chart else it will be in my mind..
The first sell signal is awesome.. Its a very strong sell signal, no doubt about that.

Coming to the buy signal (Which is a correction). The price didn't touch the bottom of the weekly cloud. If your entry is above tenken and your target is kinjun. I would see it as an early entry (I would call it as a smart entry) and early exit. If I had to enter, I would have entered after tenken crossed over kinjun because price is above the cutover and chances of reaching the bottom of the cloud in H4 will be my first target and keeps trailing.

This concept is very similar to pivot based trading.. We do not enter once the trendlines breaks, we wait for higher high and lower lows to make a pivot and then make an entry.

I have a very important question.. How do we keep trailing our stops in ichimoku. Can give me a hindsight of it.

Regards
Raj
 
Raj, I don't know if it is the EUR/USD that you are considering, but the monthly kijun is 1.3833.
I'll give my update on the EUR/USD next.


The Monthly Kinjun is 1.35098
The most important barrier is to cross the top of the cloud in H4.
My next target would be 1.351 which is the bottom of the cloud in H4 as well as descending TL from 7th Sept 11 touch 28th Sept.

Regards
Raj
 
Status
Not open for further replies.
Thread starter Similar threads Forum Replies Date
J Introductions 2
U Forex 2

Similar threads