Uploaded with
ImageShack.us
These are my weeklies. I have a set of charts specifically with only my weeklies on it because I am working with someone in the usage of static S&R's.
For now I make a long story short. I should have drawn the Fibs on here, but here's the sequence for automated scalping:
1. Draw the Fibs between each reference point (WR2>WR1, WR1> WP, WP>WS1, etc.).
2. The entry for the reversal is the reference point.
3. A conservative TP is the 38% point of the reference points.
4. Once the 3 is hit, either their is a strong reversal, like what you see in the picture. If that does not happen, then its a freight train. Watch for a strong.
For scalping and short term trades, use the S&R's in conjunction with the lower TF's--4-hour on down to the 5m, with the ichimoku.
For others watching my S&R's are doable in conjunction with your indicator of choice.
The only thing that cautions would be a strong trend on the upper TF's. If that is the case, then there are many continuations, such as a move from the WP--WR2 with no pullback.
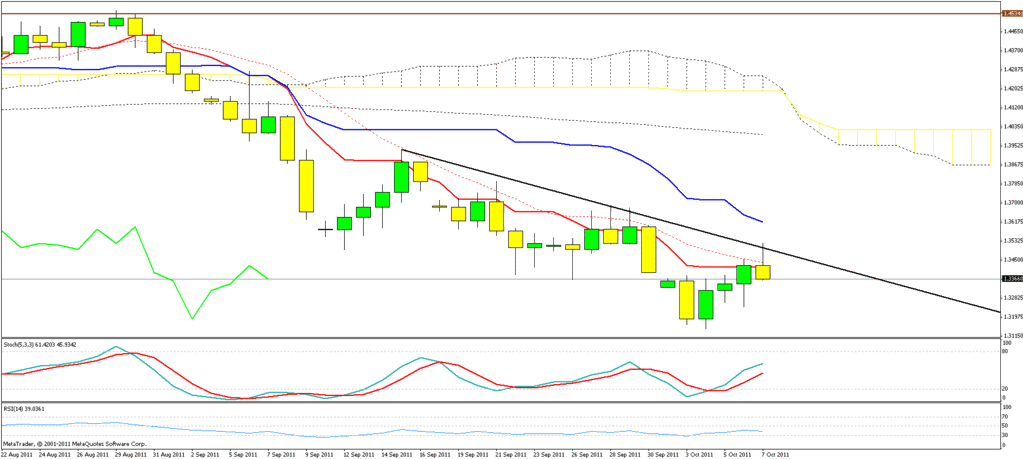
Also be aware that the levels are effective for the entire time (weekly levels during the week), but they are not as effective once the cycle has been completed after they have been hit. A live example of that is the EUR/USD. After the predicted reversal, it is struggling at the WP--1.3385.
Also the measure between the levels is of the cycle for that TF. The cycle on the EUR/USD has completed from WR1 to WP, and so it is now struggling to keep moving before it heads lower. We may not make it back to the WS1 at 1.3295 is unlikely. New cycle limits are measured for the new week, and thus, they start all over again.
As a general rule the range for any TF is between the 1 and the opposite 2. It's the mark of a very strong trend for that TF or a breakaway if the 3 is hit.


