Some of my forecasts

Status
Not open for further replies.
Crude Oil

In the medium term, this market will continue correcting the downtrend to circa 90.65. It is expected that in starting the new week, the market will begin to head south with a stop at the WS1 at 80.35. Once past there, the area short term S zone of 79.87--79.45 should be enough to contain this move before a return to the correction.
 
Gold

What is probably going to happen to start the week is a sharp move north to the WR1 at 1659. That will be a decision point. If that is broken, then we should be headed to the WR2 at 1682. That area will bring on some consolidation before we see a return to the DOWN. It still expected that over the longer term we will see the monthly kijun hit at 1433. All the downside objectives have been hit. That area will be ideal to go long, as there is strong S there.
 
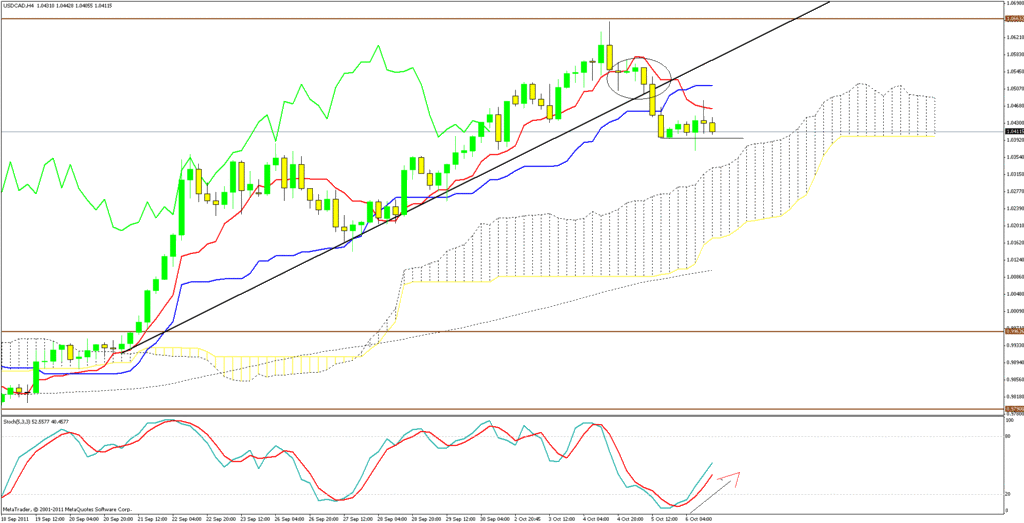
Raj, have a look for further explanation - usd/cad 4 hour chart shows the fine uptrend , Do you see the circle that is marked, It was the exit as it gives indication of a correction or a retracement it came below the h4 tenken and finallly broke the trend line and went below the kinjun. Now look at the stoch it is giving a bull divergence as the pair is moving sideways look at the future cloud in bulls, Change the time frame to daily! the daily tenken is acting as a great support which possible resumes uptrend look at the future cloud bullsih!! look at the weekly the pair has already broken the top cloud future cloud has changed to bullish! switch to monthly it is above kinjun! most favourable conditions are the bottom of the monthly cloud to be hit! these are signs for uptrend!


First of all my apologies for such a delayed reply. I have gone through each point highlighted by you, it is very clear.

Just summarizing to put the following points in my head.

1) Price crossover Tenken (weak), KinJun(Medium), Tenken Crossover KinJun(Medium), Cloud (Medium). All of them together considered very strong signal.
2) Timeframes are very important to show all are in tandem. In this chart, it shows very clearly.

Regards
Raj
 
Raj, I thought I'd get to this before I get to the EUR/USD.
First of all, the ichimoku has 5 different indicators built into 1, and for now in order to cut to the chase the ichimoku is configured through highs, lows, MA's, and current prices. The very nature of an MA cannot be backtested. The circled part was a good point made by Forexworld, but that does not necessarily mean that is what it looked like at the time of the cross. If price had made a sharp move north, then it would have looked just as good, but instead the tenken would have crossed on top of the kijun and the TL would have been broken.
I do like the way you use your candle formations in lieu of what you are looking at on the charts. Even the ones who are successful traders that use the ichimoku as a standalone, evaluate many other factors such as candle formations, price action, etc.
Another thing I learned when I first started using the ichimoku in 2007 was to use the other TF's in making a decision, which is also a point Forexworld used. That encircled area probably would not have been that good of a decision if you just hit the top of the daily cloud.

With regards to your stops when using the ichimoku, if you have entered a trade after the TK cross, then go to the kijun, count back 3 candles, and set the stop 1 pip under.
The other way to look at this is that if you are wondering if current price action has the gusto to stay in the trend, as long as the price stays above the kijun 3 candles back, then the trend is still alive. If that level is broken, then it puts down on the current trend.
Thank you Paul for a detailed explanation.
Yes I realized the importance of using different TF which Forexworld has nailed it.
Can you explain me with a chart about the stops. Any past setup that you have used it.

Regards
Raj
 
First of all my apologies for such a delayed reply. I have gone through each point highlighted by you, it is very clear.

Just summarizing to put the following points in my head.

1) Price crossover Tenken (weak), KinJun(Medium), Tenken Crossover KinJun(Medium), Cloud (Medium). All of them together considered very strong signal.
2) Timeframes are very important to show all are in tandem. In this chart, it shows very clearly.

Regards
Raj
I was acctualy pointing towards the price and tenken crossover above the kinjun above the cloud !
 
Raj, I'm on limited time now, so I'll get to this question, and then I'll answer your other question in about 6 hours from this post, as it will require more detail.
When price has crossed over the tenken and kijun is when you get the strongest signal. It is a stronger signal when price action has passed through the other side and out of the cloud.
I'll over give you some examples when I get back of when you get a strong crossover when it is just the tenken.
There is also no problem with delayed responses. This has been a fast moving thread of late.


First of all my apologies for such a delayed reply. I have gone through each point highlighted by you, it is very clear.

Just summarizing to put the following points in my head.

1) Price crossover Tenken (weak), KinJun(Medium), Tenken Crossover KinJun(Medium), Cloud (Medium). All of them together considered very strong signal.
2) Timeframes are very important to show all are in tandem. In this chart, it shows very clearly.

Regards
Raj
 
I should have made my self more on this but I think I can pass ! and tell you what I clearly meant first the second circle that I marked was the exit point of the trade if you entered on the 1st strong sell circled signal! the second circled area was never an entry point but the exit point of the 1st circled area the second circled area was also meant to show the correction has begun after hitting 0.9390! Regarding you said the price didn't touch the weekly bottom cloud there was a strong support seen at 0.9390 if you didn't notice ! As it touched there reversal started showing itself at the 4 hour chart these reversals were expected if you read the previous posts we had been talking out,! the second circle area was not at all the entry point it gave a confirmation to my long entry at 0.9462 according to the weekly and h4, I called it correction because I was just simply showing you according to the h4 ! It was never an early entry but was at 0.9462 on the basis of the weekly the target being the 4 hour kinjun was the minimum target which I was aiming for! I wouldn't have gone long at the cross over because it was below the cloud I closed it there at the h4 kinjun for the minimum! even though I know the reversal had begun but I was unsure will it be permanent or temp! see it hit the bottom of the weekly cloud I was unsure that It would because previous days weekly and monthly were adding a lot of pressure for the trend to resume up! frankly speaking Mr paul should only answer you regarding the doubts you have as I am a fresher I don't want you to get wrong this in your head because of me !
I have understood the same way as you explained in your previous chart. I know your entry is not at the second circle and it is at the tenken and your target is Kinjun.
Yes I know you have been discussing about .9390 mark earlier and I know it is strong support now. This .9390 has been strong resistance and this point has been touched many times.

The only reason that i said its early entry is because of my way of looking at things are different. I even call it as a smart enty.

I would be happy to see that u help me in clearing my doubts too. I dont think you as a fresher, you have a very good knowledge. Actually I started feeling comfortable with Ichimoku. Thanks to both of you.

Regards
Raj
All credit goes to Mr paul, It really Helps when you find the best person to discuss things with !, here were the buy signals the same chart!


Hi Paul,

I have seen that you have been talking about your S&R recently. I am confused about it. Is it a different setup.

Can you give me an overview so I can understand when you reference back with Ichimoku.

You have been talking about 85% success but completely bust your account. I have been one of them in one occassion and 2nd occassion I managed to pull it back. Thats one of the reason, I put more emphasis on Money Management and position sizing.

Regards
Raj
 
Status
Not open for further replies.
Thread starter Similar threads Forum Replies Date
J Introductions 2
U Forex 2

Similar threads