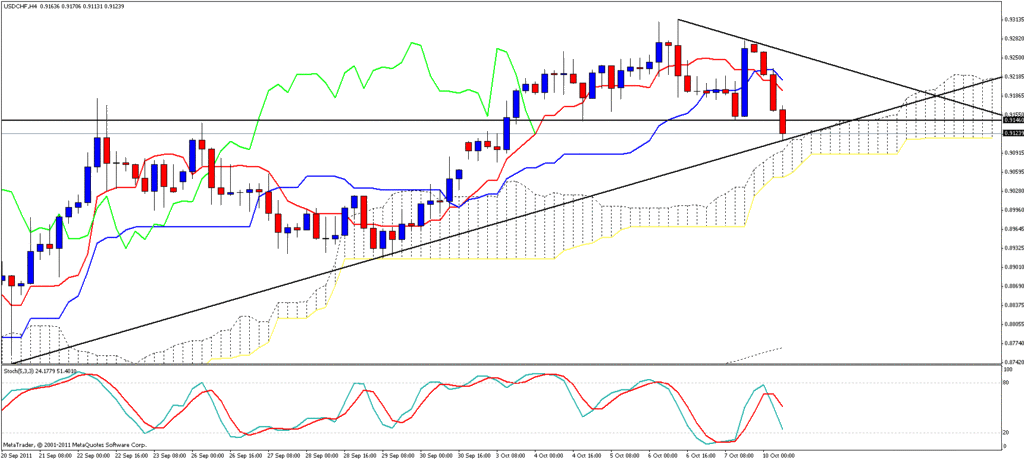
Some of my forecasts

Status
Not open for further replies.
That's fine, Raj. I don't mind your questions at all.

The S&R's that I created also have many variables. You mentioned the 2 S's and 3 R's, but then I also have dailies, monthlies, yearlies, and even the decades.
First a bit of a background. My S&R's are not just standard S&R's where a certain reversal point is detected like you would think of most S&R's. They also measure the cycle within a trend. As an example, let's say you measure the WP to the WR1. Let's say you measure the distance of those 2. Now, let's say price continues up and goes past the WR1 after stalling there. It hits the 38.2% level of WR1--WR2. Most likely, the correction will be back to at least the 38.2% mark of WP--WR1. The distance between the reference points is actually the cycle within the range of the trend.
This is also why I encourage to plot a few of the points on and watch the action. This way all viewers know I am not talking through my hat.

Another way to trade my S&R's is purely for the bounce. After it hits the first reference point for that TF have the entry order set to reverse direction and take profit at 38.2%.

The other way I use them is as a confluence with my other indicators. It was so obvious for me to short the EUR/USD at the end of last week, because it hit my WR1 at the bottom of the cloud with the stochastics OB and the SD channel at an extreme. It could only mean the sharp reversal that we had gotten.

Another way is a continuation. Let's say the WR1 is hit, then get a bounce. Now price heads back up, and consolidates on top of the WR1. Enter long and plan on riding it to the WR2.


I am at 125% profit at the time when I wiped off entire account. That was indeed sad but I have learnt a lesson, I have become very conservative and have started to give high importance to Money Management and Position Sizing.

I try to understand how experienced people follow Money Management. I have set a limit to use only 10% of Margin and limit no of open positions to 5.

So you use a combination to arrive the S&R of your methodology. How do u trade them given you have 3 S and 3 R. Which side would you trade. Would you wait for a direction to hit atleast 1 S or R or just use of direction of the trend. I have lot of questions coming up in my mind :)

Regards
Raj


Uploaded with ImageShack.us


Uploaded with ImageShack.us

This is giving an idea of the flexibility and the usage of all the TF's and how they help in determining an optimal entry.
I have been talking about for some time about the imminent huge reversal that is about to take place for the USD/CHF. The weekly tells the story, and why we are headed to at least .8512 and possibly .8190. The difference from last week is that it used to be a TK combo, but now it has diverged.

This is my live account and it shows the level I entered. I also employed a chart S in order to further evaluate this entry. Notice the 1-2-3 points that I marked off. As long as the 3 point is not broken, then the 2 point gets broken for an explosive move south. I am anticipating that event. After the 2 is broken, then we probably get a correction back to the circa area, which is where I might add to the position. At that point, Iwill have at least 2 positions for the move to the MT objective.
 
Those kinds of gains a practical over a shrot period of time using monopoly money.
If you have an amount of money to put in a separate account that you would never miss if you lost it all, then you could trade with reckless abandon. My demo account that got closed down recently was grown from 50K to 600K in 4 months. That's 1100% gains in those 4 months. I did that just to prove it can be done, even though it is not the proper way to trade, regardless of the amount of confidence you have in your trades.

Higher gains are more feasible on the practical level for ones that have the ability to hedge their trades and they know what they are doing.

Regardless, the outrageous gains you and I both displayed are just good for selling e-books. I could show daily logs of this kind of stuff, then write a book and make a mint. The problem is it would not be honest, would mislead people, and I don't need to write books when I already trade.


I know a person who turned his account from 1000$ to 143,000$ in just 11 months ! He had a 1000 pips give or take stuff, 1000 pips would double or blow off his account! It is what I call Luck ,It was high risk,He had reasonable and logical reasons behind what he did! I just did't want to believe it, It was not my cup of tea! I don't want to get there so fast !He got few calls from his broker warning him that his account will be closed if further huge risks are taken! Now he tells me he is aiming for 20% every month , It was like LMAO, ! I also know of a person (not personally) who turned his account from 1000$ to approx 500,000$in 3.7 years that was about approx 30% every month ! this is what I call trading ! Go slowly ! it is not about making money it is about winning consistently with a system ! Develop this and money will automatically follow your path! never get greedy !
 
Those kinds of gains a practical over a shrot period of time using monopoly money.
If you have an amount of money to put in a separate account that you would never miss if you lost it all, then you could trade with reckless abandon. My demo account that got closed down recently was grown from 50K to 600K in 4 months. That's 1100% gains in those 4 months. I did that just to prove it can be done, even though it is not the proper way to trade, regardless of the amount of confidence you have in your trades.

Higher gains are more feasible on the practical level for ones that have the ability to hedge their trades and they know what they are doing.

Regardless, the outrageous gains you and I both displayed are just good for selling e-books. I could show daily logs of this kind of stuff, then write a book and make a mint. The problem is it would not be honest, would mislead people, and I don't need to write books when I already trade.
Yes correct btw I was going to buy a book based on ichimoku by nicole elliott, I still have to learn to trade short terms-lol
And I wonder why did they close your demo account for gaining 1100% gains in 4 months using the virtual money! They got so scared that you might open a live account with them so they closed your demo to give you a strong signal that are not interested -lol
 
Excellent book!
I do not read trading books, as I do not like to be brainwashed or trade from someone else's talking points. A broker, however, sent the book to me in 2008. The name of the book is called "Ichimoku Charts".

It has happened before where I got such outrageous gains on a demo, and then I was sent an e-mail they were closing me down. In this case, it was GCI. They do not accept clients from the USA, and so I assume that is why they closed me down.
I miss that demo more than any of them because it had many of the Indian markets that I forecasted for many of the people here at TJ.

BTW, I'm not giving the name of the broker, but I opened another account with a new broker. So far, I am very happy with them. I'll be happy to recommend them if they are still this good 6 months from now.


Yes correct btw I was going to buy a book based on ichimoku by nicole elliott, I still have to learn to trade short terms-lol
And I wonder why did they close your demo account for gaining 1100% gains in 4 months using the virtual money! They got so scared that you might open a live account with them so they closed your demo to give you a strong signal that are not interested -lol
 
Re: EUR/USD and the NFP

rajesh read the above on how to trade S and R! I call it the free milk giving cow !
Having these levels can help us to get an good idea of the TP and Stops but trading them is not easy because unless it can match your strategy and expectations.

The tough thing is to identify the direction and to know whether there will be a pullback after every target has been reached. The strength of the move is also very key in this setup.

Regards
Raj
 
eur/usd still looking for bulls

The next target should be 1.371 which is daily kinjun. It is a broad consolidation as mentioned by Paul. Each milestone is very far and makes it broader. I find it Ichimoku very interesting with different timeframes, its just I get confused after sometime. I think I need a software to plot it an excel with different timeframes for easy reading.

This pair is in such a mode that cannot be traded for medium term except short term. The 4H chart is showing bullish, where as daily chart downtrend is in question.

Regards
Raj
 
Status
Not open for further replies.
Thread starter Similar threads Forum Replies Date
J Introductions 2
U Forex 2

Similar threads