bought tatamotors @ 134 s/l 113 , rcom 161 s/l 143 , zee @ 92 s/l 88 , dlf @ 157 s/l 139 , ranbaxy @ 182.8 s/l 159 .... All of these stocks are close to their major monthly supports. Holding a jan futures short @ 2689 as a hedge with nifty 2700 call @ 46.
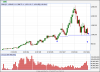
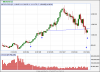
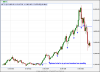
Will forget sbi , Infosys , reliance & LT for now ... infy has already given a break down and is hanging on borrowed time , SBI is close to breaking down from a h & s pattern on the monthly charts , reliance doesnt have support till 930 , 807 and later 580 and LT looks good for 454. However will buy tatasteel around 145 to 150 s/l 134 , relcap around 320 s/l 310 and rpl around 58 - 60 s/l 55 incase of panic next week . If all these stoplosses are taken out next week then its time to forget buying shares (as these are the last monthly supports left in these stocks) and wait till the monthly charts get in to an uptrend as it happened in june 2003 (finishing a 3 year bear market which saw nifty crashing from 1818 to 849). On that occasion nifty broke out from a double bottom in 2003 and the next downtrend on the monthly came five years later in 2008 .As of now just looking to buy the monthly supports and selling weekly resistance.
Enc. nifty , infy & sbi charts ...Uparrows in infy , sbi , nifty charts are possible support areas. Had to mention nifty here as it is the only chart i have which covers 10 years which included the last bear market we had.