


Trading Plan for 07 Sep 2018

Background : Background shows weakness, Hourly chart marks lower swing high lower swing low and a down trend channel. Price is trading near the
over-bought region of the channel. Hourly chart shows buying climax with up-thrust and no demand bar. So expect lower price.
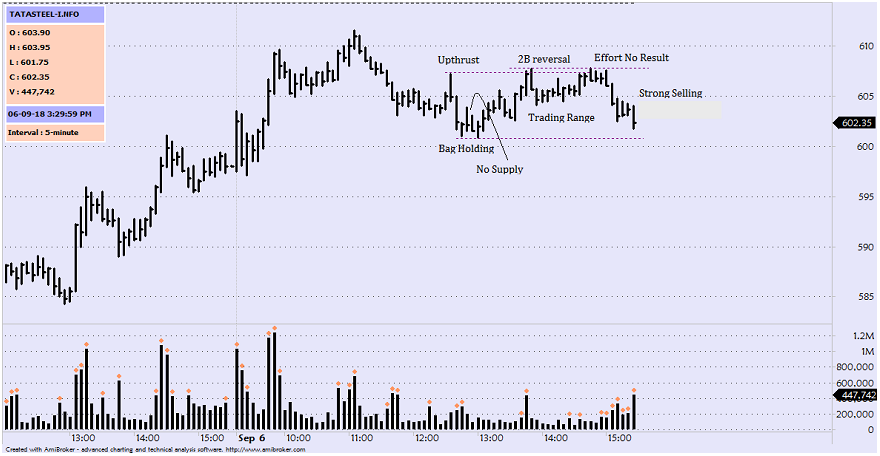
5m chart marks a trading range between 607 - 601. Strong supply is seen near 607 near the range top in yesterday's closing session. Price is marked down since on strong volume. Price is heading towards the range bottom where bag holding was seen yesterday.
Need to see how price reacts to any demand near 600/602 in today's session.
Background : Background shows weakness, Hourly chart marks lower swing high lower swing low and a down trend channel. Price is trading near the
over-bought region of the channel. Hourly chart shows buying climax with up-thrust and no demand bar. So expect lower price.
5m chart marks a trading range between 607 - 601. Strong supply is seen near 607 near the range top in yesterday's closing session. Price is marked down since on strong volume. Price is heading towards the range bottom where bag holding was seen yesterday.
Need to see how price reacts to any demand near 600/602 in today's session.