Status
Not open for further replies.
Guys, there are things which are sometimes not under your control.. As a business I would not be able to share it with you..Hopefully you will appreciate it... I jumped the gun and put it on this forum and it is my bad that I did it.. I should have done only once everything was ready.. So you could blame it on me for letting you know this way early than it should have been done.. As Zerodha we have never communicated with any tentative dates for the equity launch on the Ztrader... That said, I am hoping to have something concrete for you by tuesday on when we can go live...
Hello sachin its been 1 year since i spoke to you after reading this i think
If your nest trader goes on live in few weeks i can also do cash , future
with you

I guess everything will be online so no manual pledging , can buy sell any moment and also no 30 % cash as margin as Mr hanan told me in e-mail
earlier

One more thing i would like to ask you is Edelweiss has two Nest plaforms in one quotes are updated evey 4 seconds
where as in other one provided to me quotes update 2-3 times every second
and is compareable with nse now tick by tick ( i have compared then both one big screen my self )

WHICH ONE WILL YOU PEOPLE AT ZERODHA PROVIDE

ALSO DID YOU DO ANY REDUCTION IN TRANSACTION CHARGES SINCE THEN AS I SEE IN RKSV WEB SITE ITS 240 PER CRORE
 

megapixel

Well-Known Member

Hi Ninza ...Thanks for the post.

I have checked your link .... there is a chart for underlying price vs time in your link.....but not option price vs time.

you know option price does not necessarily follow the underlying price ...because there are 6 parameters which impacts the option price ...underlying price is just one parameter among them.


Having said this ...
do you believe when NIFTY is highest option price is highest ?
do you believe when NIFTY is lowest option price is lowest ?

I guess it is not ( correct me if I'm wrong) ....As I'll be interested in squaring-off options (not exercise) hence I want to look at the chart of option price vs time.

question is where do I find it ?
 
Last edited:

megapixel

Well-Known Member
Omnesys has taken over our backoffice vendor.. What this means for you is, integrated front office and backoffice solution.. Multibrowser compatibility will also soon be up..
beautiful. ...happy that you have kept your promises....This is a great news....Please dont forget to add a profit/loss report in Equity segment.....after all ...we all want to know how much we have made at the end of the day :clap:
 
Hi Ninza ...Thanks for the post.

I have checked your link .... there is a chart for underlying price vs time in your link.....but not option price vs time.

you know option price does not necessarily follow the underlying price ...because there are 6 parameters which impacts the option price ...underlying price is just one parameter among them.


Having said this ...
do you believe when NIFTY is highest option price is highest ?
do you believe when NIFTY is lowest option price is lowest ?

I guess it is not ( correct me if I'm wrong) ....As I'll be interested in squaring-off options (not exercise) hence I want to look at the chart of option price vs time.

question is where do I find it ?
Now I am confused as to what are you looking for.

http://www.nseindia.com/charts/webt...OptionType=CE&Template=fo_options_Intrday.jsp

This is today's intraday chart for nifty 5100 CE in blue or purplish colour along with nifty index price line in green colour. Is this not what you are looking for?
 

megapixel

Well-Known Member
Now I am confused as to what are you looking for.

http://www.nseindia.com/charts/webt...OptionType=CE&Template=fo_options_Intrday.jsp

This is today's intraday chart for nifty 5100 CE in blue or purplish colour along with nifty index price line in green colour. Is this not what you are looking for?
No.

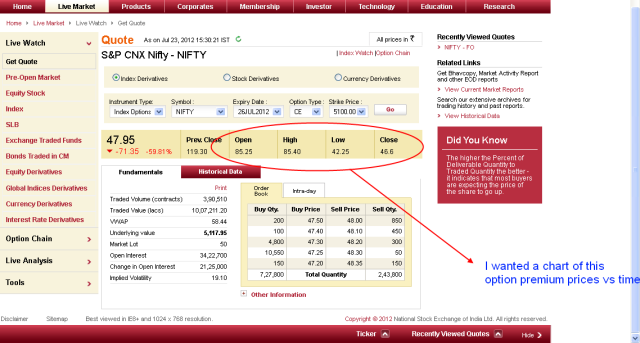
What I was looking is a option premium chart ....see this comment below ...


If you ask me why...then the reason is we pay option premium to buy option CALL ....I want to buy CALL option at lower prices ...so I need the chart.
 
No.

What I was looking is a option premium chart ....see this comment below ...


If you ask me why...then the reason is we pay option premium to buy option CALL ....I want to buy CALL option at lower prices ...so I need the chart.
Megapixel ji, when the option of 5100 CE is 75 rs at 11 am then the chart will show 5175 at 11 pm. when the cmp of 5100 ce is 117 rs at 2 pm then the chart will show 5217 at 2 p.m.
 

megapixel

Well-Known Member
Megapixel ji, when the option of 5100 CE is 75 rs at 11 am then the chart will show 5175 at 11 pm. when the cmp of 5100 ce is 117 rs at 2 pm then the chart will show 5217 at 2 p.m.
I did not get you with this..... I just wanted a intraday graph of option premium price fluctuations over time. ..... is it not possible or it is not available ?
 
Status
Not open for further replies.

Similar threads