General Trading Chat

vijkris

Learner and Follower
Yes, transfer everything to TP sir's account along with debt if any ;).

Vivek
HaHa, Donald Trump will be the first one to transfer all the Debt !!
Air India ka debt bhi accept kijiye please !!! :lol:
 
Nifty Statistical Analysis (2008- 2016)
2284 Trading Days
Nifty Spot data

Code:
Range Open Days		1722			Higher Open Days		372			Lower Open Days		190	
Close in Range		832	48.32%		Close in Range		102	27.42%		Close in Range		53	27.89%
Close > PDH		449	26.07%		Close > PDH		232	62.37%		Close > PDH		12	6.32%
Close < PDL		441	25.61%		Close < PDL		38	10.22%		Close < PDL		125	65.79%
i hope its clear to understand.
If Nifty opens within PDR, it has 50% probability of closing within the range
If Nifty opens abv PDH, it has 60% probability of closing abv PDH
If Nifty opens blw PDL, it has 60% probability of closing blw PDL

Also a stat with regard to Open vs PDC :
Code:
Open/Close vs PDC	2284					
Higher open	1301			Lower open	983	
Close > PDC	810	62.26%		Close > PDC	358	36.42%
Close < PDC	491	37.74%		Close < PDC	625	63.58%
If Index opens above PDC, 60% probability of closing above PDC
If Index opens below PDC, 60% probability of closing below PDC

I found no useful stat of Day Open and Day Close.
The above stat may help me to form a bias where i be confident to be right 50% of the time atleast. :)

(I took enough care that there are no errors in calculations from my end, if any mistakes, plz inform )
 
The pic isn't enlarging, text not readable. If you could kindly share direct link.
bhai, I do not know why the image is not enlarging. I have uploaded it on sendspace now

https://www.sendspace.com/file/4anc74

The message in the image is very important. Highly Recommended for everyone to read it once.

Thanks and best regards
 
Nifty Statistical Analysis (2008- 2016)
2284 Trading Days
Nifty Spot data

Code:
Range Open Days		1722			Higher Open Days		372			Lower Open Days		190	
Close in Range		832	48.32%		Close in Range		102	27.42%		Close in Range		53	27.89%
Close > PDH		449	26.07%		Close > PDH		232	62.37%		Close > PDH		12	6.32%
Close < PDL		441	25.61%		Close < PDL		38	10.22%		Close < PDL		125	65.79%
i hope its clear to understand.
If Nifty opens within PDR, it has 50% probability of closing within the range
If Nifty opens abv PDH, it has 60% probability of closing abv PDH
If Nifty opens blw PDL, it has 60% probability of closing blw PDL

Also a stat with regard to Open vs PDC :
Code:
Open/Close vs PDC	2284					
Higher open	1301			Lower open	983	
Close > PDC	810	62.26%		Close > PDC	358	36.42%
Close < PDC	491	37.74%		Close < PDC	625	63.58%
If Index opens above PDC, 60% probability of closing above PDC
If Index opens below PDC, 60% probability of closing below PDC

I found no useful stat of Day Open and Day Close.
The above stat may help me to form a bias where i be confident to be right 50% of the time atleast. :)

(I took enough care that there are no errors in calculations from my end, if any mistakes, plz inform )
Thanks for the analysis Charles. :thumb:
Did you do all these calculations in Excel or in some specific Database etc.

Thanks and best regards
 

vagar11

Well-Known Member
This post should help those who had trouble understanding TD setup and countdown.

TD Sequential
What is it for?
Applying Tom DeMark’s TD Sequential serves the purpose of identifying a price point where an uptrend or a downtrend exhausts itself and reverses.
.
What are the main components of TD Sequential?
TD Sequential has two parts – TD Setup and TD Countdown. The first phase of TD Sequential starts with a TD Setup and is completed with a 9 count. When the 9 count is completed, it is at that point, a price pause, price pullback, or reversal is likely. It is also at that point where TD Sequential starts the second phase with TD Countdown and is completed with a 13 count. When the 13 count is recorded, it is at that point, a price pause, price pullback, or a reversal is likely.
.
Just 9 and 13. Is it really that simple?

Absolutely not. Other DeMark indicators and other technical analysis indicators should align with TD Sequential’s ability to pinpoint potential reversals. For example, if a leading indicator identifies a condition for a market reversal is likely in the near future, the job of TD Sequential is to provide the “when” for the reversal is likely to take place.
.
What is TD Buy Setup, TD Sell Setup, TD Buy Countdown, and TD Sell Countdown?
TD Buy Setup is the name for a TD Setup when the DeMark counts are recorded as prices are trending lower. Conversely, TD Sell Setup is the name for a TD Setup when the DeMark counts are recorded as prices are trending higher. The same goes for TD Countdown. A TD Buy Countdown is the name for TD Countdown when the DeMark counts are recorded as prices are trending lower and a TD Sell Countdown is the name of TD Countdown when the DeMark counts are trending higher.


Below are four visual examples in describing the components of TD Sequential.
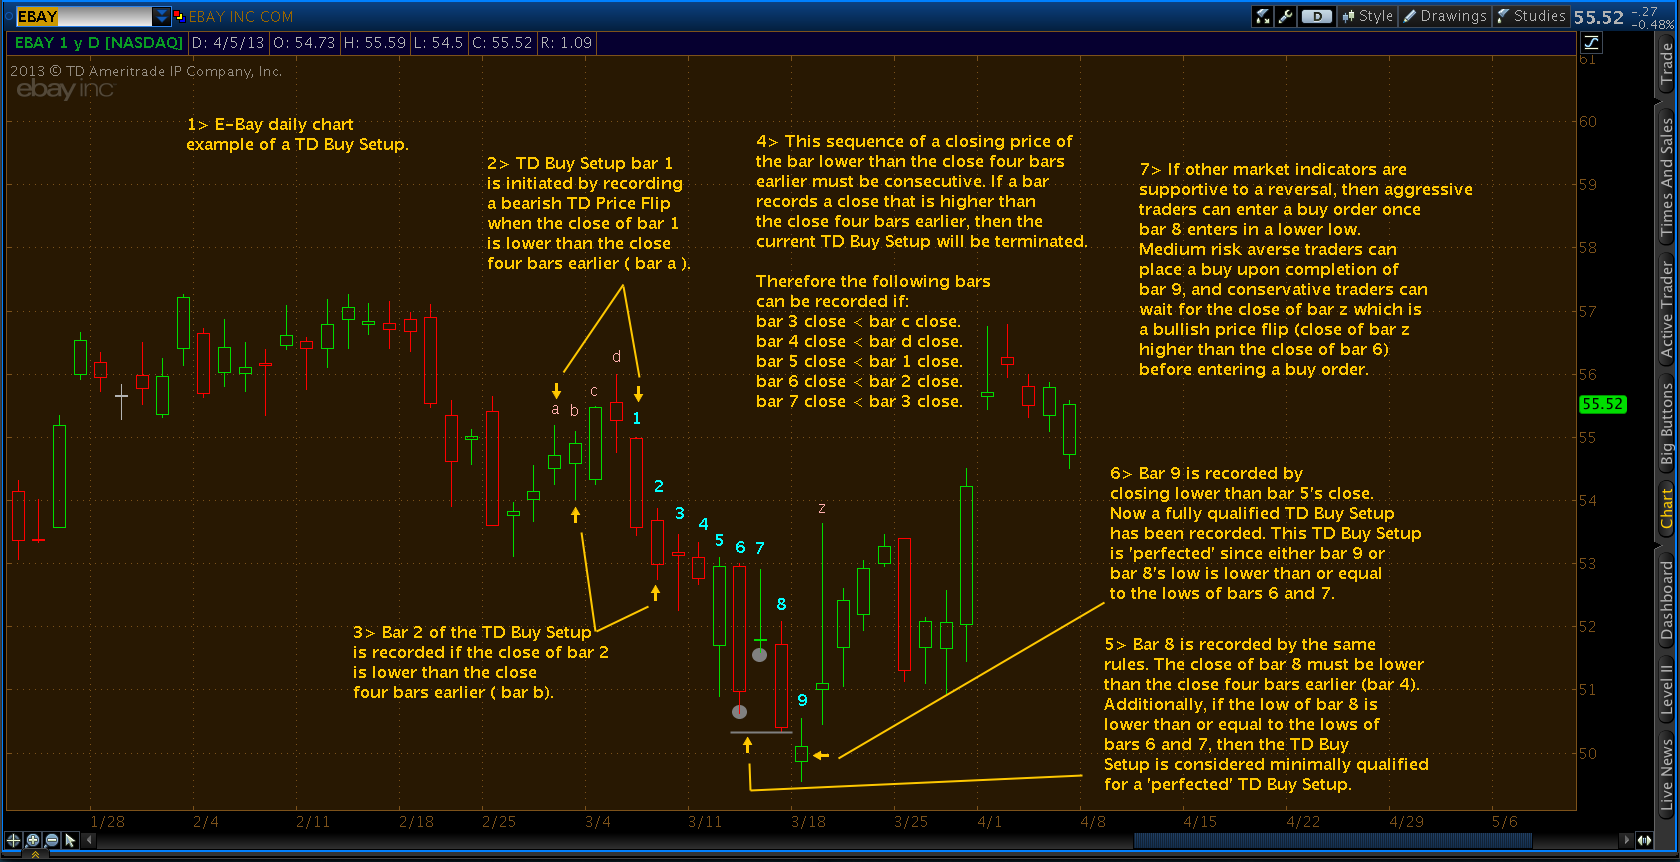
TD Buy Setup for Ebay (EBAY)

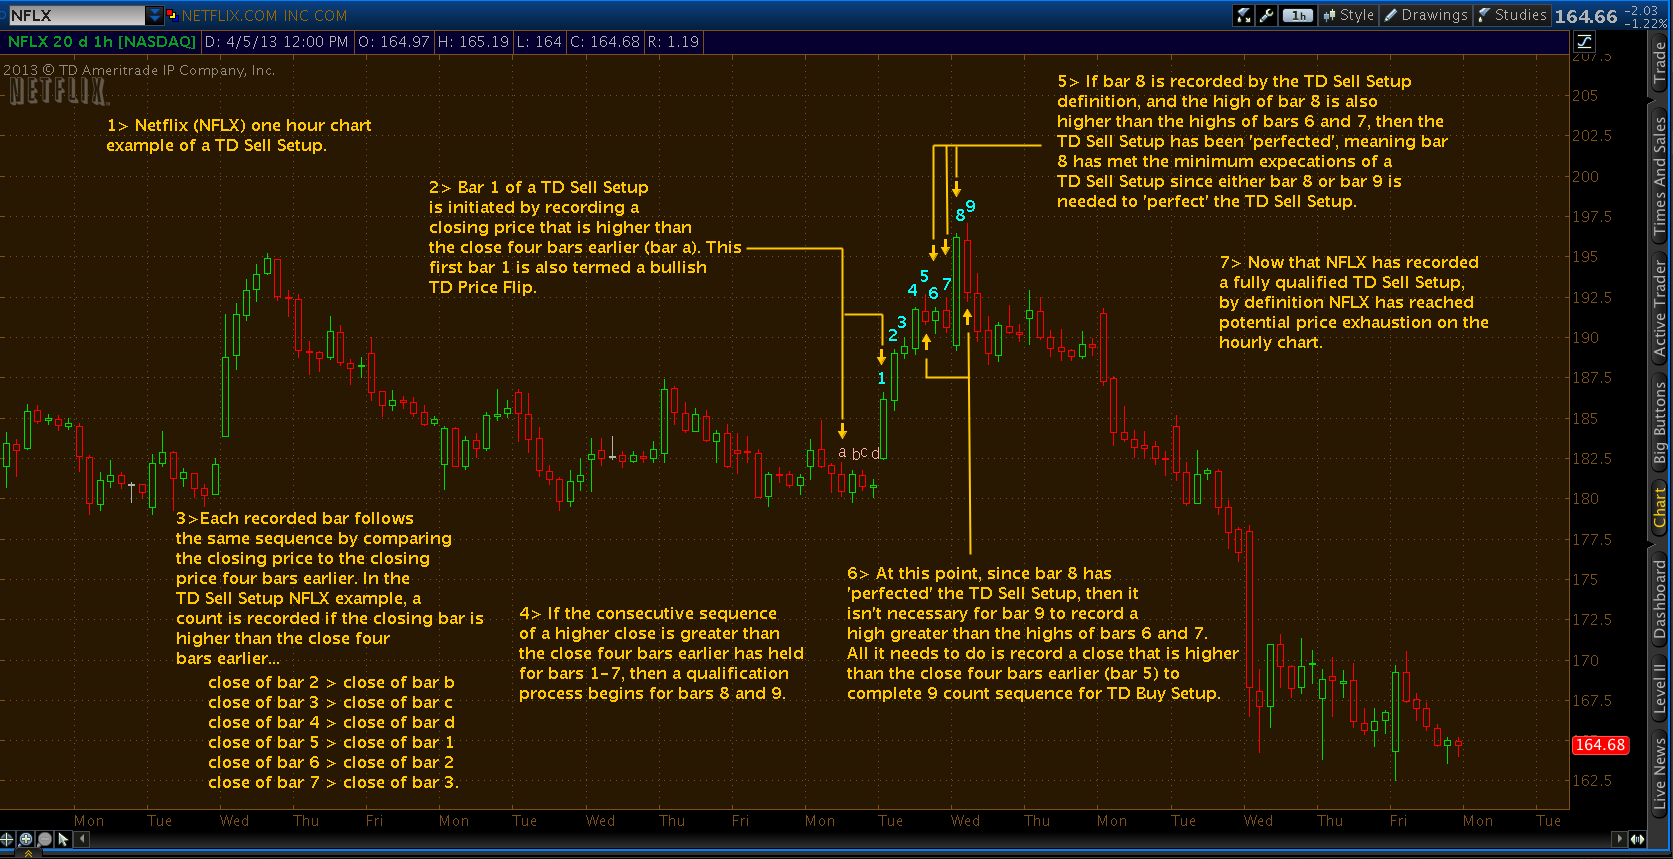
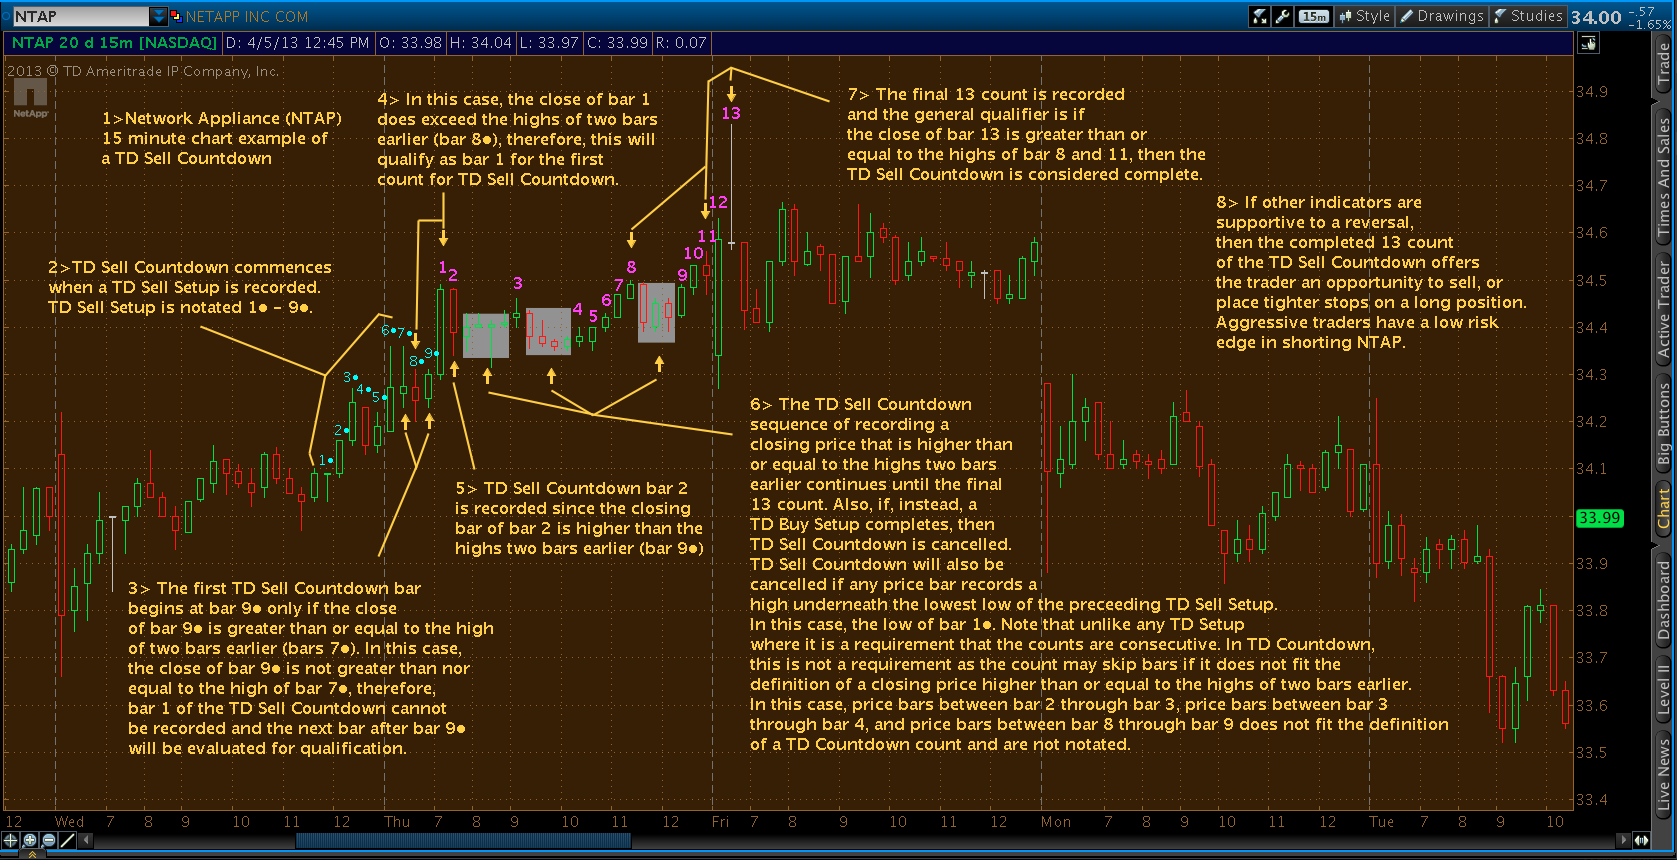
The written explanation of each example is numbered in order.


TD Buy Countdown for Zynga (ZNGA)


TD Sell Setup for Netflix (NFLX)


TD Sell Countdown for Network Appliance (NTAP)


Source : https://tradetrekker.wordpress.com/tdsequential/
 
Last edited:
Last edited:

Similar threads