how much return you expect from commodity market

Status
Not open for further replies.

ayush2020

Well-Known Member


I expected that some one will point out this .Its ok let me tell you one more clue.

The day before while the price was consolidating what did the stoch do. It stayed in OB >5 bars indicating strong bullish sentiment.

Thats what Raghav sir taught me. Let the price consolidate , let the stoch stay in OB>5 bars and then let the stoch comedown and then look for bullish action on lower TF and make entry and one make huge gains.Do you want to make it still simplistic.

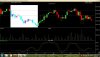
OK. On Mon stoch stays in OB for >5 bars in 60 Min chart .Now we waited for stoch to comedown and take turn upside on 60 Min chart .That happens around 5-6PM.Now we make entry in lower TF.but where?I told we look for bullish PA on lower TF. for me lowest TF is 5 Min.


Entry with very very low risk and one makes 1000 points in just 3-4 hours.

Thats how money is made from the mkt.:)
so as per this if 5 bars r above overbought zone... we can take long position when it will come down to near oversold region with some minimum stop loss..
 

Niranjana

Well-Known Member
so as per this if 5 bars r above overbought zone... we can take long position when it will come down to near oversold region with some minimum stop loss..
Also you should have a price action supporting the move.If you can do that you will be able to get big trades many times.

The price action, reading of momentum,stoch and levels all these together produce powerfull trades.
 
Also you should have a price action supporting the move.If you can do that you will be able to get big trades many times.

The price action, reading of momentum,stoch and levels all these together produce powerfull trades.
Hi ACS n NJ

I haven't got my A/C access yet on sharekhan (3-4 days it will take), completed the formalities yesterday.

The IT guy installed trade tiger n im using there demo a/c now, just startd analyzing live charts well enjoying every bit of it.

Rite now im analyzing, price and volume action with candlesticks,
correct me if im wrong NJ it's like sideways trend till now

Oh forgot to mention its 10 min TF !

The area i have highlighted is showing volume in the support of bear as the volume is increasing for the red bars with price going down.

no strategy(bcoz I need to learn 1st before applying :) I have used its just seeing the bars movement, price and volume , still need to learn so many things from you before I go for my 1st trade:)

I was checking my status of PM enabled couldn't locate it wats ur mail id ?
 

Attachments

Status
Not open for further replies.

Similar threads