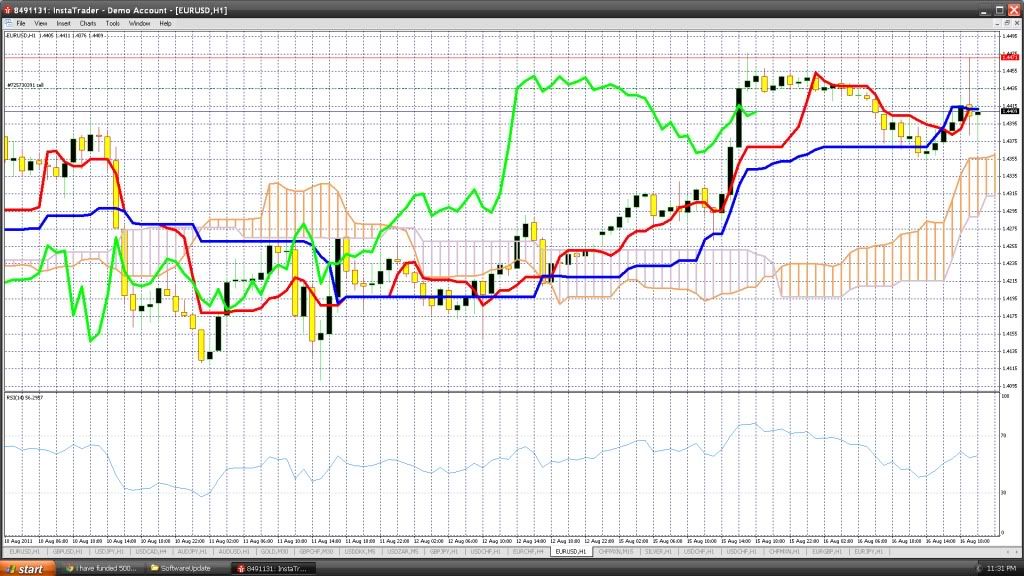
These are nice!. Your red line is the tenken, the blue is the kijun, and the green the chinkou.
Once the chinkou crosses the candles, that is the signal to enter the direction is crossed.
The tenken is the leader or the quicker of the indicators between it and the kijun. Once it crosses, it is indicating either a trend change or at least the market has gone sideways.
The color the cloud is now is indicating there is a bullish bias, and the other color indicates a bearish bias. The wider the cloud, the stronger the bias.
The part where the kijun has leveled, and it is also level with the cloud is indicating a strong S. I would not think of going short until the bottom of the cloud is broken through.
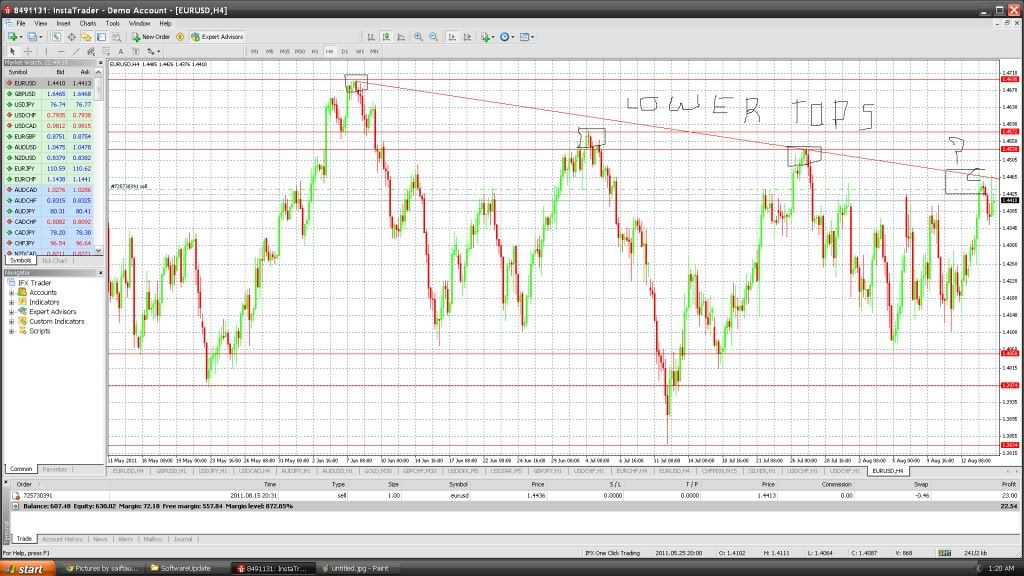
After that, you need to go to higher TF's to confirm this market is going higher, or to confirm we are headed to 1.4145.
The RSI is around 50. This is the thing I don't like about it. Will it take it out, or curve up? If it takes it out, will it be convincing enough to take price with it?
The fact it has been in an uptrend since Aug. 10 is a nice observation, but it still does not say a lot. What could you tell me about future price action if the trend was up since Aug. 10, or up since yesterday, or up since May 10? Elliot Wave theorists can put a time value on a trend, among other things, but we won't go there.
I still would like to hear your reason why you believe the market is headed to 1.4145 based on what you see on this chart.
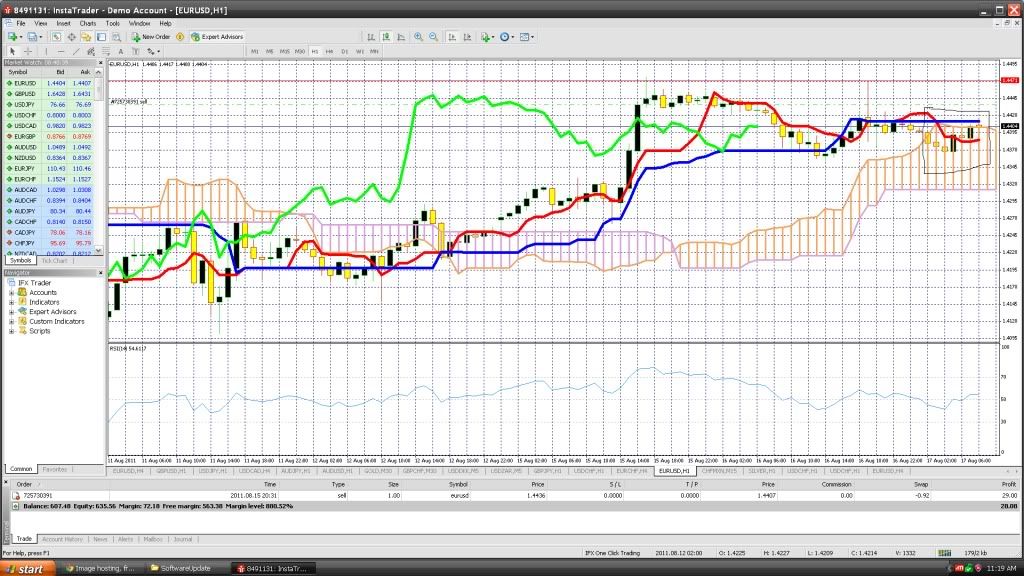
observing the clouds cross each other when trend changes am i right sir??
e/u could possibly comming down to 1.4145 i think, for an uptrend it should break 1535 as recent high? but 1 hour chart shows the trend is up from august 10th!