


i have funded 500$ , what amount should i aim for everyday?
- Thread starter Piratetrader
- Start date
- Status
- Not open for further replies.
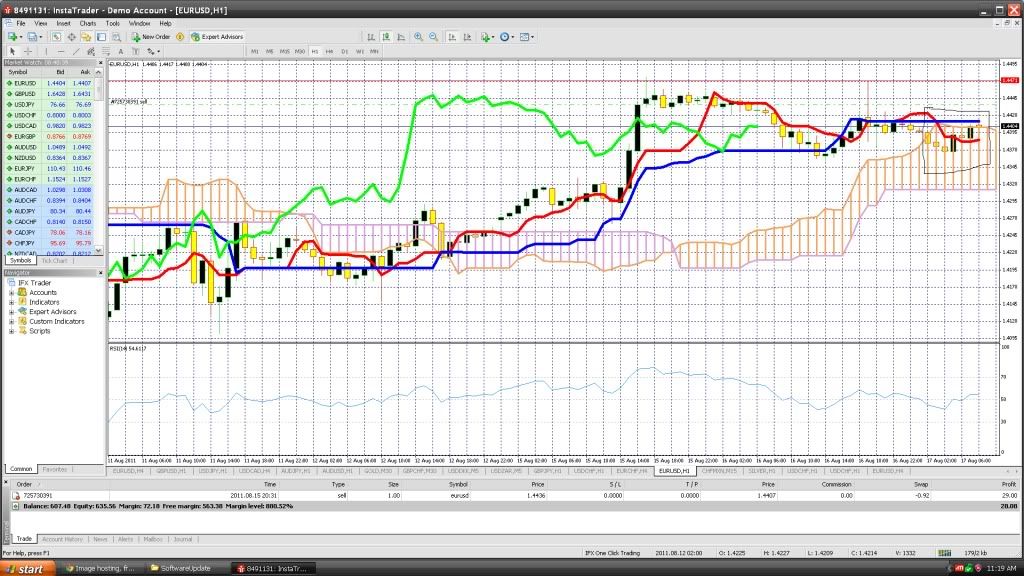
The quantity of candles does not matter in ichimoku. The cloud only represents equilibrium. The market approached the cloud from the side instead of dropping through the top
The clouds never wander. They are the indicator. It is price that wanders.
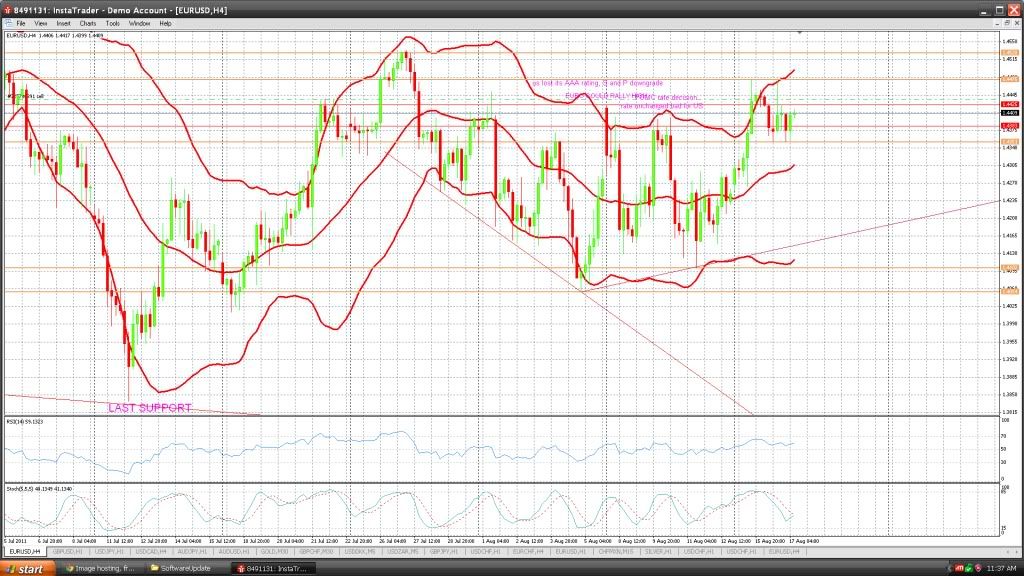
The trend will look that way a lot on the hourly during the slow time of the day, which is from mid-NY to the beginning of London. This is why I kept referring to the daily chart. The price was resting securely on top of the cloud, and eventually we were and still are going to get a strong move north.
The clouds never wander. They are the indicator. It is price that wanders.
The trend will look that way a lot on the hourly during the slow time of the day, which is from mid-NY to the beginning of London. This is why I kept referring to the daily chart. The price was resting securely on top of the cloud, and eventually we were and still are going to get a strong move north.
sir in ichimoku today the upper clouds have wandered and came up and crossed the candles, the candles are below the kijun, a 3 candle break above it could move the pair higher.Rsi holding just above 50 indicating a strong trend. tenken is sideways, overall the condition is choppy
RSI over 70 or 85 does not indicate sell. I said before it indicates a warning only and should be used as a confluence. If anything, above 70 is a warning of a sharp move north such as the one we got today.
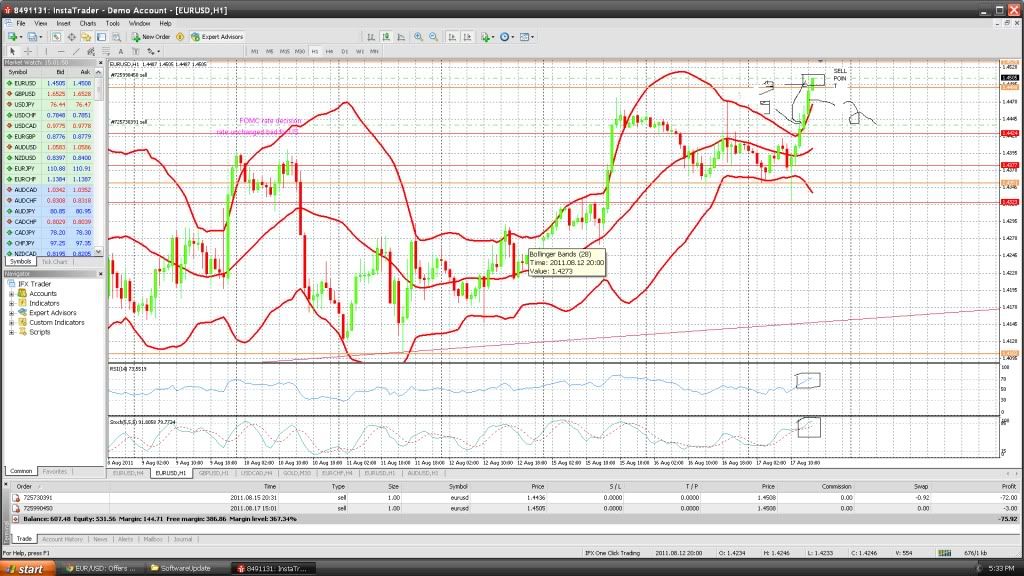
Sir here is the recent chart I SOLD EUR/USD AT 1.4505 , TARGETTING 1.3950 after the 3 each 1 hour BULLISH candles were formed, RSI AND STOCHASTIC ABOVE 70 AND 85 .INDICATING A SELL HERE IS THE CHART - PLEASE TELL ME WHAT DO YOU THINK -
Sir here is the recent chart I SOLD EUR/USD AT 1.4505 , TARGETTING 1.3950 after the 3 each 1 hour BULLISH candles were formed, RSI AND STOCHASTIC ABOVE 70 AND 85 .INDICATING A SELL HERE IS THE CHART - PLEASE TELL ME WHAT DO YOU THINK -
RSI over 70 or 85 does not indicate sell. I said before it indicates a warning only and should be used as a confluence. If anything, above 70 is a warning of a sharp move north such as the one we got today.

The quantity of candles does not matter in ichimoku. The cloud only represents equilibrium. The market approached the cloud from the side instead of dropping through the top
The clouds never wander. They are the indicator. It is price that wanders.
The trend will look that way a lot on the hourly during the slow time of the day, which is from mid-NY to the beginning of London. This is why I kept referring to the daily chart. The price was resting securely on top of the cloud, and eventually we were and still are going to get a strong move north.
Again, this is why I mentioned a couple of traits about Bollinger Bands. There are many times when 5-8 consecutive candles hug the extreme line. Here's an example. Look at a strong trend on the hourly, then drop down to the 15-min and notice how many consecutive candles hug the line
The other thing to look for is even after the candle makes a break from the band, it an uptrend the upper band is probably pointing strongly to the upper extreme. That is probably indicating that after the break, a sideways motion will ensue before another break north.
If anyone tells you (This is not my opinion.) it is time to reverse direction just because the extreme band was hit, they do not know what they are talking about.
Let me also recommend Columbus' thread on Bollinger Bands. He is also very learned on BB's, and has a wealth of knowledge just on this subject.
If Babypips said exactly what you said about reversing when those levels are hit, then they do not know what they are talking about. I can flood your thread with examples of that.
The only confusing part you have is that you are in a hurry to trade. Traders 101 last for much longer than a few months. There is basic, conceptual knowledge you need to get a grasp on, and then build from there. The nature of your questions tells me a lot. That is also good you ask the questions, because all my comments are meant constructively.
In essence, you have a ways to go before thinking about trading live. The one thing I strong urge is observation and being objective in your observations-- not seeing in your observations what you want to see.
Another thing that could help is open a chart on a market you have no interest in trading, then tell me what you see. You will see occasional times when the candles will hug the upper or lower bands for long periods of time. You will see when 70 is hit on the RSI that many times price will continue to go up (or 30 and down).
RSI over 70 and stoch over 85 indicates a warning!! and should be used with the other indicators to work with! i will always keep in mind these stupid babypips.com!! sir but it crossed the BB upper band and straight went up, so i waited for 3 hour candle to pass to enter a sell! ?
- Status
- Not open for further replies.
| Thread starter | Similar threads | Forum | Replies | Date |
|---|---|---|---|---|
| M | TST Funded trader | Introductions | 0 | |
|
|
TrADing dAIry / Funded acC / cOMbINE hELP | Trading Diary | 79 | |
| S | non delivery of shares + fund not refunded | Investors Grievances | 2 | |
| C | RPL IPO Share amount not refunded | Investors Grievances | 3 |