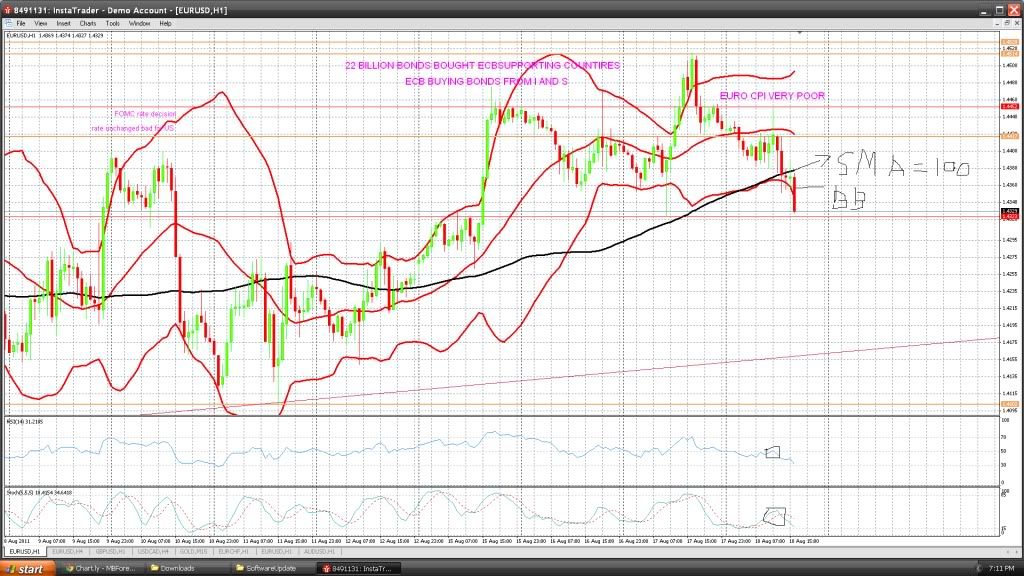
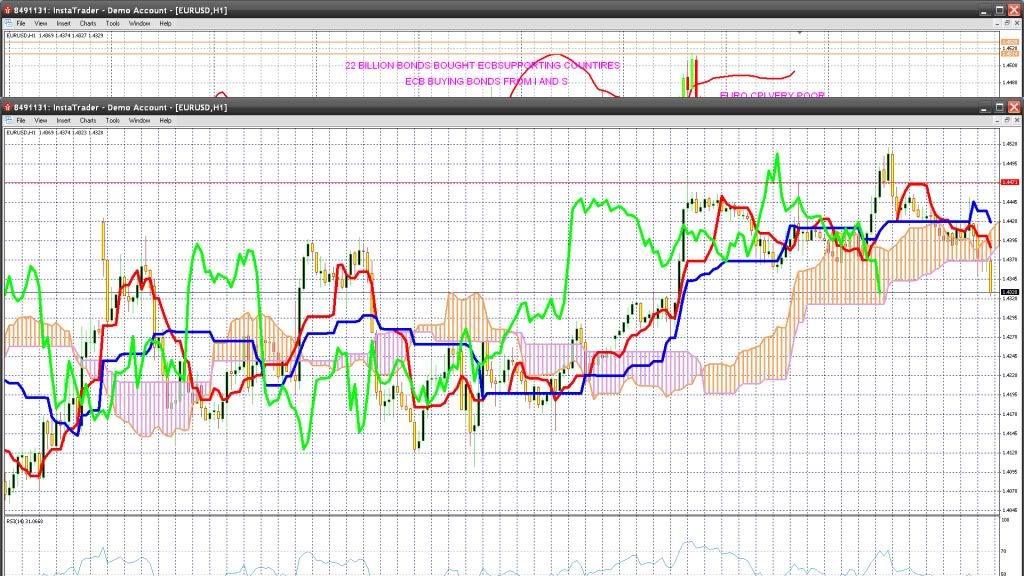
Sir i am posting a chart please have a look i sold eur/usd when the price got below the lowest bolligner band, rsi under 50 showing weak trend,stoch in between also the black line is 100 sma, the price also got below that indicating a sell, and it also broke the blue line in ichimkou and also broke the bottom clud, red line showing downtrend sir pleasee see and tell me have i entered right?