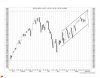
Since the rally in SP 500 is reaching its climax , I though it would be most appropriate to post a Chart showing the rally from June which is perfectly channeled. The channel looks much more prominent on a weekly chart. If all goes well, it should test the 1445-1450 mark, the upper most end of the channel before turning down sharply. Marginal overshoot can never be ruled out due to momentum, but it is absolutely evident that we reaching the climax of this rally. Fasten your seat-belts for a roller coaster ride in the last few months left in 2012.


")